Researchers have found a new method to detect NAD+, and they published their wonderful work on Science Magazine: http://science.sciencemag.org/content/352/6292/1474.
Creative Biomart provides NAD+ related protein products for research applications.
[table caption=”Related Products” width=”800″ colwidth=”100|200|180″ colalign=”left|left|center|center|center”]
Cat. #,Product name,Source(Host),Species,Conjugate
PARP1-4276R,Recombinant Rat PARP1 Protein,Mammalian Cells,Rat,His
PARP2-12373M,Recombinant Mouse PARP2 Protein,Mammalian Cells,Mouse,His
PARP4-156H,Recombinant Human PARP4 protein GST-tagged,Wheat Germ,Human,GST
PARP11-3307R,Recombinant Rhesus monkey PARP11 Protein His-tagged,Mammalian Cells,Rhesus monkey,His
NMNAT1-77H,Recombinant Human NMNAT1 protein His-tagged,Insect cell,Human,His
[/table]
Beyond its role in redox reactions, nicotinamide adenine dinucleotide (NAD+) is an essential substrate for sirtuins and poly (adenosine diphosphate–ribose) polymerases (PARPs). Although these enzymes serve different functions—sirtuins catalyze protein deacylation, whereas PARPs catalyze ADP ribosylation—both cleave the glycosidic bond between nicotinamide and ADP-ribose, resulting in the irreversible consumption of NAD+. As a consequence, mammalian cells rely on salvage pathways that recycle the nicotinamide generated by these NAD+-consuming enzymes to maintain NAD+ concentrations above a critical threshold. Nicotinamide phosphoribosyltransferase (NAMPT), the enzyme that converts nicotinamide to nicotinamide mononucleotide (NMN), is essential for maintaining NAD+ concentrations. The conversion of NMN to NAD+ is catalyzed by three enzyme isoforms—namely, NMN adenyltransferases (NMNATs) that are differentially localized (NMNAT1, nucleus; NMNAT2, Golgi, cytosol-facing; NMNAT3, mitochondria)—suggesting the existence of distinct subcellular NAD+ pools. Localized fluctuations in NAD+ levels may regulate the activity of the NAD+-consuming enzymes, which are also highly compartmentalized; however, there has been no direct experimental evidence for this type of regulation because the concentration of free NAD+ (i.e., NAD+ available as a substrate) within these subcellular compartments has so far been unknown. Moreover, it has been unclear whether these NAD+ pools are segregated or readily exchangeable between subcellular compartments.
To address these issues, we developed a genetically encoded biosensor for measuring free NAD+ concentrations within subcellular compartments. This sensor comprises a circularly permuted Venus fluorescent protein (cpVenus) and a bipartite NAD+-binding domain modeled from bacterial DNA ligase (Fig. 1A) that exclusively uses NAD+ as a substrate. Point mutations were introduced to prevent NAD+ consumption and allow monitoring of NAD+ within the predicted physiological range. Purified sensor and cpVenus had major excitation peaks at ~500 nm that fluoresced at ~520 nm (Fig. 1B). NAD+ decreased sensor fluorescence (excitation at 488 nm) in a dose-dependent manner and minimally affected cpVenus fluorescence (Fig. 1, B and C). A second excitation peak at 405 nm was unaffected by NAD+ binding (Fig. 1C), allowing ratiometric (488 nm/405 nm) measurements for normalizing sensor expression levels. In vitro, the apparent NAD+ dissociation constant (Kd) of the sensor was ~65 μM (Fig. 1D). Absorbance measurements revealed two major species at ~415 and ~488 nm that appeared to interconvert upon NAD+ addition around a ~450-nm isosbestic point. This indicates that the NAD+-bound species loses its fluorescence at 488 nm, converting to a species that absorbs at 415 nm but is nonfluorescent. Accordingly, NAD+ did not affect the fluorescence lifetime after 488-nm excitation, providing further evidence that fluorescence after 488-nm excitation solely represents the unbound fraction.
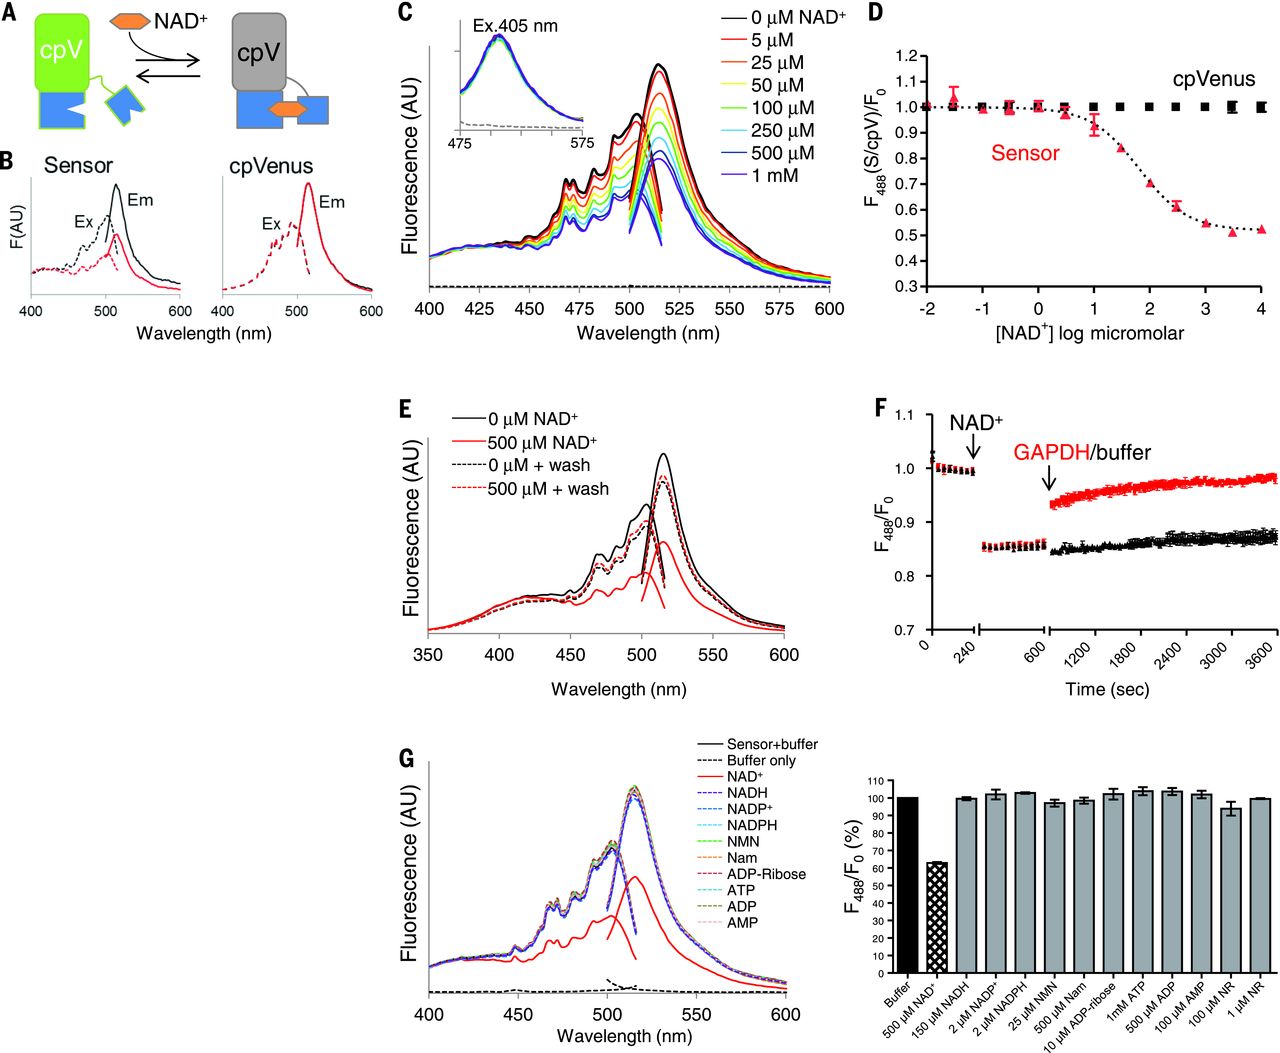
To confirm the reversibility of NAD+ binding, we showed that elution of NAD+ from the sensor returned fluorescence to that of a control sample (Fig. 1E). We also monitored fluorescence in real time in the presence of glyceraldehyde-3-phosphate dehydrogenase (GAPDH), which has a higher affinity for NAD+ than the sensor does and thereby competes for free NAD+ in the absence of substrate. We observed a rapid recovery of fluorescence upon GAPDH addition (Fig. 1F).
To determine sensor specificity, we evaluated fluorescence in the presence of related nucleotides and NAD+ precursors (Fig. 1G). Only NAD+ appreciably decreased sensor fluorescence. The absolute fluorescence intensities of the sensor and cpVenus displayed similar sensitivities to pH, and the NAD+-dependent responses of the sensor were minimally affected from pH 6.5 to 8.0. Thus, pH effects can be accounted for by normalizing to cpVenus. Fluorescence intensity was slightly affected by temperature, but the Kd of the unbound pool was not appreciably affected between 20° and 37°C.
Localization sequences directing the sensor to the nucleus, cytoplasm, and mitochondria (Fig. 2A) did not affect responses to NAD+ in vitro. We generated clonal human embryonic kidney (HEK) 293T lines stably expressing the localized sensors or their corresponding cpVenus controls and verified that expression of the sensors did not affect NAD+ levels. To estimate concentrations of free intracellular NAD+, we permeabilized cells with digitonin to allow internal NAD+ to equilibrate with externally determined concentrations and monitored fluorescence by flow cytometry. Equilibration was assessed with propidium iodide (PI), whose molecular size is similar to that of NAD+. NAD+ decreased fluorescence of the cytoplasmic sensor in a dose-dependent manner (apparent Kd, ~300 μM; dynamic range, 30 μM to 1 mM) (Fig. 2B) and minimally affected cpVenus. The mean of the fluorescence ratio (488 nm/405 nm) for the cytoplasmic sensor in nonpermeabilized HEK293T cells relative to that of cpVenus was interpolated to reveal a free NAD+ value of 106 μM [95% confidence interval (CI), 92 to 122 μM]. Using the same strategy, we determined that the concentration of free NAD+ was 109 μM in the nucleus (95% CI, 87 to 136 μM) and 230 μM in mitochondria (95% CI, 191 to 275 μM). Mitochondrial measurements were fit to the curve obtained with the cytoplasmic sensor. We confirmed the cytoplasmic calculations with live microscopy, using adherent human cervical cancer HeLa cells permeabilized with saponin and equilibrated with varying external NAD+ concentrations (Fig. 2C). Equilibration with 100 μM NAD+ minimally changed sensor fluorescence compared with either higher (1 mM) or lower (0 μM) NAD+ concentration. We observed similar fluorescence changes in populations of partially permeabilized HeLa cells that were analyzed by flow cytometry. Many nuclear and cytoplasmic NAD+-consuming enzymes have Michaelis constant (Km) values around 100 μM for NAD+, and the Km of mitochondrial SIRT3 is around 250 μM, supporting the idea that these enzymes are poised to be regulated by local NAD+ fluctuations. The similarity in nuclear and cytoplasmic NAD+ levels suggests that NAD+ is readily exchangeable between the nucleus and cytoplasm.

Mammalian cells predominantly rely on the NAMPT-dependent salvage pathway for NAD+biosynthesis, so presumably NAD+ concentrations in all subcellular compartments would be affected by NAMPT inhibition. To test this idea, cells were treated with FK866 {N-[4-(1-benzoyl-4-piperidinyl)butyl]-3-(3-pyridinyl)-2E-propenamide}, an NAMPT inhibitor, and NAD+concentrations in various compartments were monitored with live flow cytometry (Fig. 3A) or microscopy. In the absence of FK866, NAD+ concentrations remained constant. The rate of free NAD+ depletion was similar in the nucleus and cytoplasm (half-life, ~2 hours) and largely depended on PARP activity, as demonstrated by treatment with the inhibitor Tiq-A [thieno(2,3-c)isoquinolin-5-one]. Depletion of mitochondrial free NAD+ occurred at a slower rate (half-life, ~8 hours) and was minimally affected by Tiq-A. FK866 treatment for 16 hours significantly decreased free NAD+ by more than 85% in all compartments—nuclear (8 μM; 95% CI, 6 to 11 μM), cytoplasmic (3 μM; 95% CI, 0.1 to 6 μM), and mitochondria (32 μM; 95% CI, 27 to 38 μM); this decrease was not prevented by Tiq-A treatment.

We confirmed our pharmacological studies with NAMPT by using small interfering RNAs (siRNAs), which depleted free NAD+ in all compartments. Nicotinamide riboside (NR) increased free NAD+ to 83 μM (95% CI, 72 to 98 μM) through a parallel pathway that bypasses NAMPT (Fig. 3B). NR itself was not recognized by the sensor (Fig. 1G) and did not alter sensor fluorescence. The levels of free NAD+ correlated with PARP activity, induced by H2O2 genotoxic stress (Fig. 3C).
A heretofore unanswered question is how pools of NAD+ in the nucleus, cytoplasm, and mitochondria are established and maintained. To address the specific roles of NMNAT isoforms in the creation and maintenance of compartmentalized NAD+ pools, we used validated siRNAs to systematically deplete the NMNAT enzymes that catalyze the final step of NAD+ biosynthesis in each of these subcellular compartments. Depletion of NMNAT2 decreased cytoplasmic NAD+ to 58 μM (95% CI, 50 to 67 μM), consistent with its subcellular expression pattern. Nuclear NAD+ concentrations, however, were not significantly affected, indicating that NMNAT1 is sufficient to meet the nuclear NAD+ demand but cannot fully compensate for depletion of NAD+ in the cytoplasm. This finding is consistent with the lethality of individual knockout animal models. Depletion of NMNAT1 did not significantly change nucleocytoplasmic NAD+ concentrations, but levels were lower. We wondered whether the relatively similar amounts of NMNAT1 and NMNAT2 in HEK293T cells masked the NMNAT1 contribution to the cytoplasmic compartment, so we examined HeLa cells, which express relatively less NMNAT2. In HeLa cells, depleting NMNAT1 significantly decreased cytoplasmic NAD+ to 38 μM (95% CI, 32 to 44 μM). Together, these data demonstrate that NMNAT1 can contribute to the cytoplasmic NAD+ pool and highlight cell type–dependent differences in NAD+ regulation.
Our data indicate that free NAD+ in mitochondria fluctuates distinctly from that in the nucleocytoplasm (Fig. 3A). The mitochondrial NMNAT isoform, NMNAT3, is thought to generate mitochondrial NAD+; consistent with this idea, depleting NMNAT3 in HEK293T cells significantly decreased mitochondrial NAD+ concentrations to 103 μM (95% CI, 88 to 123 μM) (Fig. 4A). Depleting NMNAT2 also decreased mitochondrial NAD+ concentrations (Fig. 4A). This suggests that NAD+ produced in the cytoplasm can influence mitochondrial stores and that NMN is not the sole source of mitochondrial NAD+.

Supporting this idea, NMNAT3 depletion in HeLa cells, which contain low amounts of this enzyme, did not affect mitochondrial NAD+ concentrations. In contrast, NMNAT2 depletion both decreased cytoplasmic NAD+ to 38 μM (95% CI, 33 to 45 μM) and decreased mitochondrial NAD+ to 134 μM (95% CI, 113 to 161 μM) (Fig. 4B). Addition of NR did not restore mitochondrial NAD+ concentrations, implying that cytoplasmic NAD+, and not NMN, maintains mitochondrial NAD+ in HeLa cells (Fig. 4B). Thus, there appear to be at least two mechanisms for maintaining mitochondrial NAD+ in various cell types: conversion of NMN by NMNAT3 and transport of cytoplasmic NAD+. A NAD+ transporter has been identified in bacteria, yeast, and plants, but a mammalian homolog has not yet been identified.
Read more, please click here.