
Principle and Protocol of Surface Plasmon Resonance (SPR)
Surface plasmon resonance (SPR) is one of the commonly used technologies for detailed and quantitative studies of protein-protein interactions and determination of their equilibrium and kinetic parameters. SPR provides excellent instrumentation for a label-free, real-time investigation of protein-protein interactions.
Now I want to introduce the principle and protocol of SPR for you.
Principle
SPR can be also used for thermodynamic analysis, epitope mapping, and to determine analyte concentration. The SPR-based binding method involves immobilization of a ligand on the surface of a sensor chip which has a monolayer of carboxymethylated dextran covalently attached to a gold surface. The ligand of interest is immobilized on the surface of the sensor chip using well-defined chemistry allowing solutions with different concentrations of an analyte to flow over it and to characterize its interactions to the immobilized ligand (Fig. 1). The SPR signal originates from changes in the refractive index at the surface of the gold sensor chip. The increase in mass associated with a binding event causes a proportional increase in the refractive index, which is observed as a change in response. These changes are measured as changes in the resonance angle (δθ) of refracted light when the analyte, flowing in a microfluidic channel, binds to the immobilized ligand and increases in density at the sensor chip. Importantly, for protein-protein interactions the change in refractive index on the surface is linearly related to the number of molecules bound. The response signal is quantified in resonance units (RU) and represents a shift in the resonance angle, where 1RU is equal to a critical angle shift of 10-4 deg or 10-12 gmm-2. When a steady-state is achieved (all binding sites occupied), the maximum RU is determined (n: number of binding sites in ligand).
RUmax=nRUL(MWA/MWL)
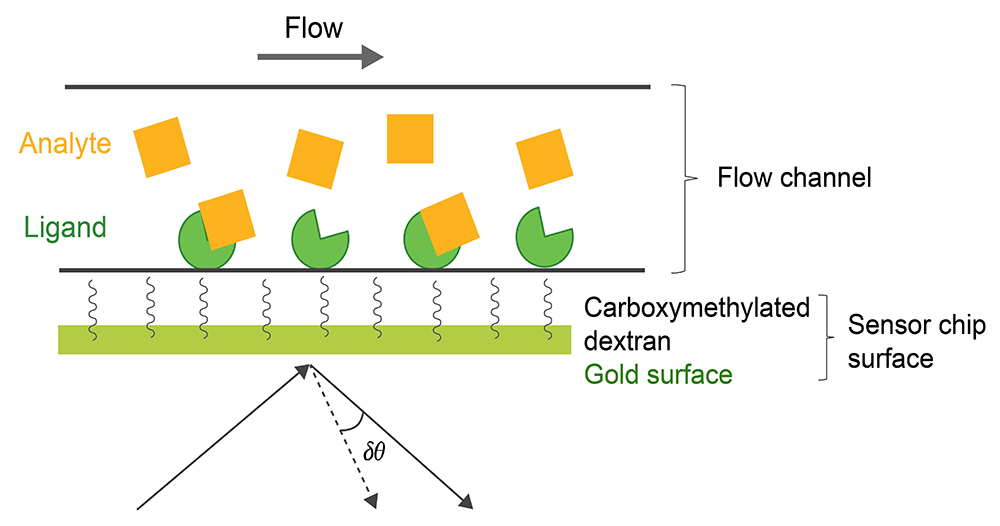 Fig.1. Experimental setup of a SPR experiment.
Monitoring the change in the SPR signal over time produces a sensorgram, a plot of the binding response (RU) versus time which allows different stages of a binding event to be visualized and evaluated (Fig. 1). During the injection of an analyte, the binding response increase is due to the formation of analyte–ligand complexes at the surface and the sensorgram is dominated by the association phase. After a certain time of injection, a steady state is reached, in which binding and dissociating molecules are in equilibrium. The decrease in response after analyte injection is terminated is due to dissociation of the complexes, defining the dissociation phase. Depending on the dissociation rate of the tested ligand, some assays may require a regeneration step in order to reach the baseline again. Fitting the sensorgram data to an appropriate kinetic binding model allows calculation of kinetic parameters such as the association (ka) and dissociation (kd) rate constants, and the binding affinity of the tested interactions (Fig.2).
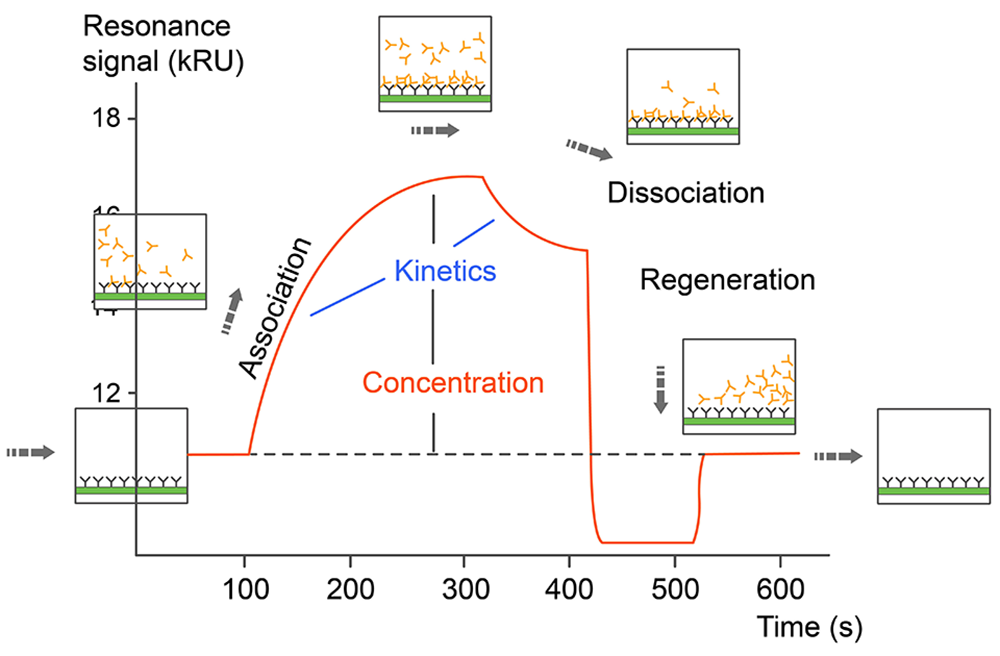 Fig.2. Sensorgram data of SPR
There are three factors may affect the sensorgram result: kinetic, analyte concentration and diffusion rate.
The kinetic could also analysis from sensorgram, for different analytes which have same affinity with the ligand would have different kinetics. See different sensorgram bellow.
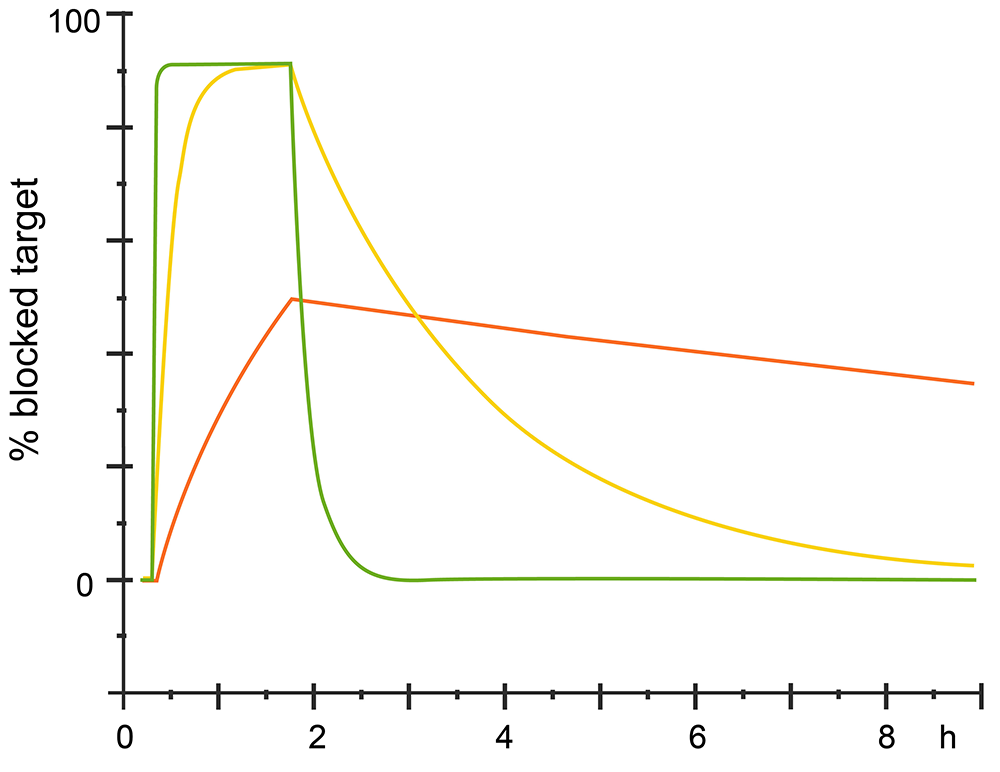 Fig.3. Different kinetics with same affinity
The analyte concentrations should be confirm before final SPR experiment, which is critical for the experiment. The concentration range should span 10× below the Kd to 10× above the Kd. You should choose the optimal analyte concentration for SPR.
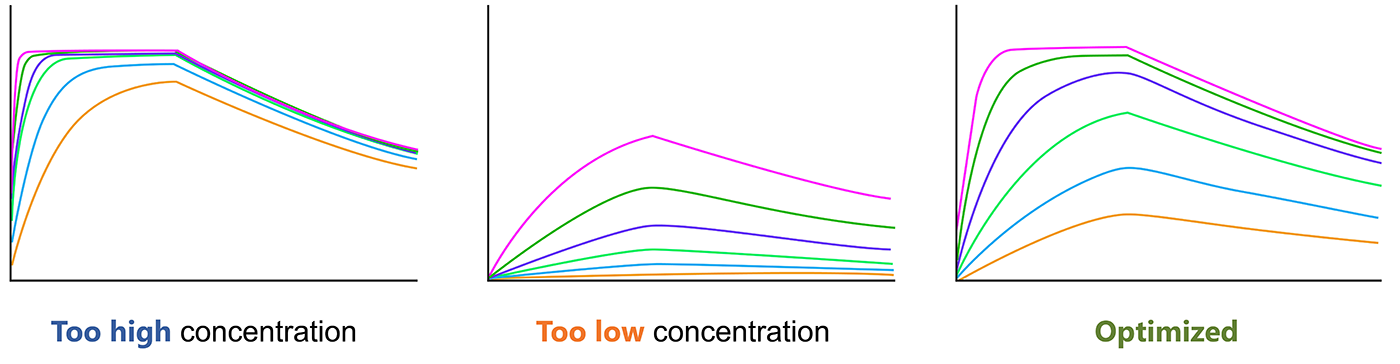 Fig.4. Optimize the analyte concentration before SRP experiment
The diffusion rate could also affect sensorgram result. If the diffusion rate is slower than the association rate, mass transfer effects can be observed. Apparent rate constants are smaller when mass transport limited binding occurs. In this situation, the kinetic data is inaccurate, too.
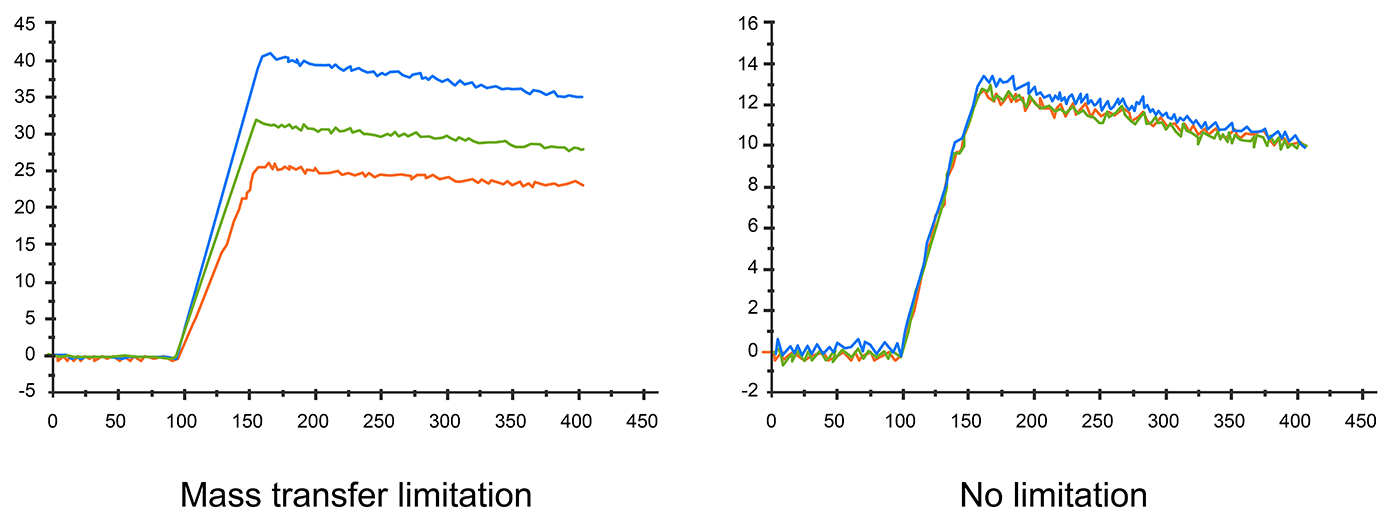 Fig.5. Different flow rates affect sensorgram
Protocol
- Express and purify ligands and analytes;
- Choose appropriate sensor chip, see their characters in table 1;
- Determining the pH and ligand concentration for optimal immobilization: dilute protein sample in buffer prepared at several pH, following the SURFACE PREPATRATION process and choosing the condition of higher surface concentration of ligand on the chip.
- Regeneration scouting and surface performance test, following REGENERATION SCOUTING and SURPACE PERFORMANCE TEST and then select REGENERATION METHOD to run the experiment.
- Select BINDING ANALYSIS and DIRECT BINDING to investigate protein binding.
- Select KINETIC ANALYSIS and choose MASS TRANSFER to run kinetic assay accompany with binding experiment.
- Data analysis and kinetic constants determine.
Table1. Available Sensor Chips and Their Characteristics and Applications
| Sensor Chip | Surface | Characteristics and Applications |
| CM5 | Standard surface—Carboxymethylated dextran matrix | Excellent chemical stability; Versatile chip suitable for most applications |
| CM4 | Low carboxylation—Carboxymethylated dextran matrix with lower degree of carboxylation than CM5, i.e., less negatively charged | Reduces nonspecific binding of highly positively charged molecules that may be found, for example, in crude samples Convenient for measurement of low Rmax needed in kinetic applications |
| CM3 | Short dextran—Carboxymethylated dextran matrix, with the same level of carboxylation as CM5, but shorter matrix | For low immobilization levels and work with cells, viruses, and multicomponent complexes with high molecular weight analytes |
| CM7 | High Carboxylation—Comparable with the CM5 chip but has a higher density of carboxymethylated dextran | Gives higher immobilization capacity; Ideal for applications that use small molecules and fragments |
| C1 | Flat carboxymethylated surface | For work with particles such as cells and viruses, and in applications where dextran matrix is undesirable |
| SA | Carboxymethylated dextran matrix preimmobilized with streptavidin | Captures biotinylated ligands such as carbohydrates, peptides, proteins, and DNA fragments |
| NTA | Carboxymethylated dextran matrix preimmobilized with NTA (nitrilotriacetic acid) | Designed to bind histidine-tagged ligands via metal chelation; Allows control of steric orientation of ligand component for optimal site exposure |
| HPA | Flat hydrophobic surface | For studying lipid monolayers interacting with membrane binding biomolecules and membrane-associated interactions |
| L1 | Carboxymethylated dextran matrix modified with lipophilic substances | For rapid and reproducible capture of liposomes with retention of lipid bilayer structure |
We will be glad to discuss details of intended interaction studies with you and develop experimental strategies/methods tailored to your requirement. Please see SRP service in our web and get in contact with Creative BioMart.