
Real-time Quantitative PCR
BACKGROUND
A protein expression needs gene transcription and translation. Whether gene transcription or the quantity of gene transcription clearly reflect the protein expression level. Therefore, it’s critical for the information of protein expression to detect the quantity of target gene transcription. Real-time quantitative PCR (real-time qPCR) is a common experimental technique of molecular biology based on PCR. This technology shifts molecular diagnostics toward an automated, high-throughput technology with less turnaround times. The PCR reaction generating copies of a DNA template exponentially which makes the quantity of template could be detected. Real-time qPCR is a reliable detection of products generated during each cycle of the PCR process.
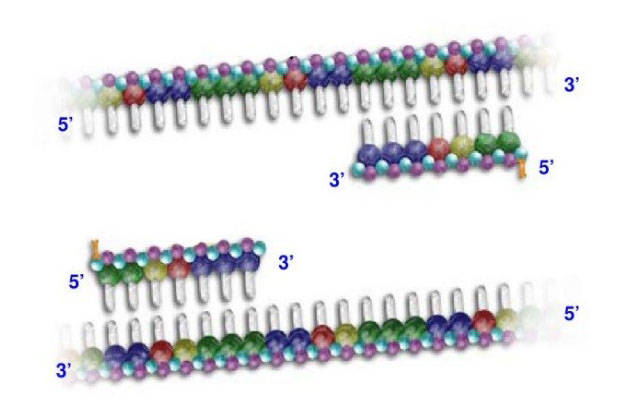
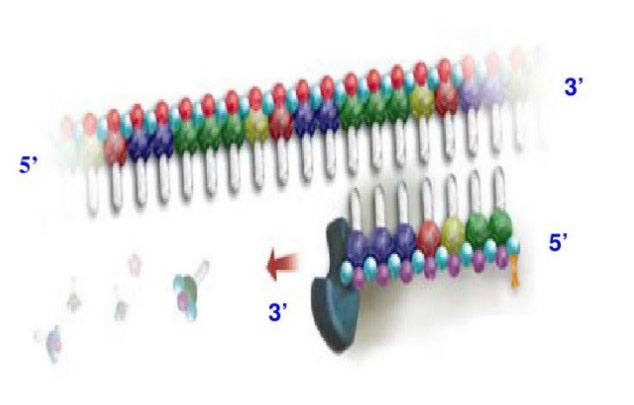
PCR is a common technique to amplify DNA. Thus, we need reverse-transcript the isolated RNA from cells to cDNA first. In order to amplify a small number of cDNA, real-time qPCR has a homologous reaction system with PCR: a cDNA template; at least one pair of specific primers, deoxyribonucleotides, a suitable buffer solution and a thermostable DNA polymerase. In addition to this mixture, a substance marked with a fluorophore is added to be measured for one or more specific products. Add the whole reaction system to a thermal cycler, each PCR cycle of the rate of generation is measured. A PCR cycle consist of a series of temperature changes, the process of Q-PCR are usually repeated 20-30 times. These cycles normally consist of three stages: (1) At the temperature about 95℃, the double chain of nucleic acid is separated. (2) At around 50-60℃, the primers are binding to the DNA templates. (3) At the temperature around 68-72℃, DNA polymerase facilitates the polymerization.
PRINCIPLE
1. Amplicon detection
There are various chemistries as available real-time qPCR probes: the dsDNA-intercalating agent (SYBR® Green 1), hydrolysis probes (TaqMan®), dual hybridization probes, molecular beacons scorpion probes and so on. We mainly introduce the principles of first two probes which are the most commonly used.
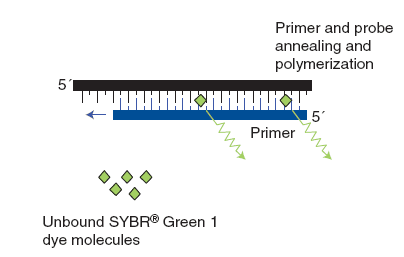
(1) The dsDNA-intercalating agent SYBR® Green 1
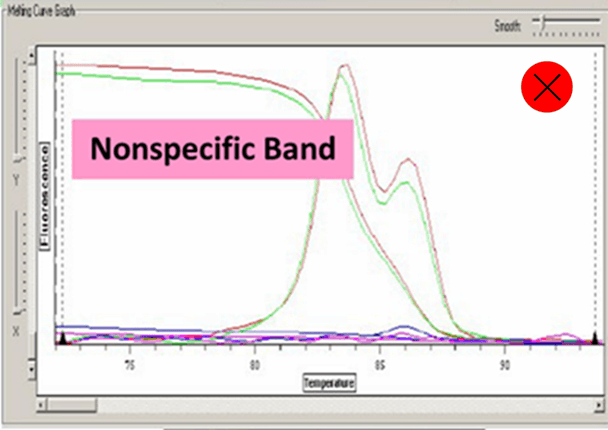
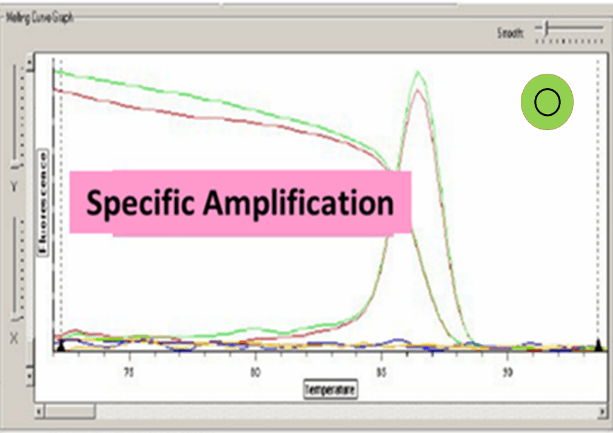
SYBR® Green 1 is a non-specific fluorescent DNA-binding dye that intercalates into dsDNA. SYBR® Green 1 emit little fluorescence when unbound with dsDNA. After primer annealing and polymerization, SYBR® Green 1 intercalates within the dsDNA product, result in an increase of detected fluorescence. Advantage of SYBR® Green 1 that it is relatively cheap as it can be used with any pair of primers for any target. The main disadvantage of this method is that it is non-specific dye which binds to all dsDNA like primer-dimers and nonspecific PCR products. Therefore, we should compare melting curves to increase the specificity of the reaction.
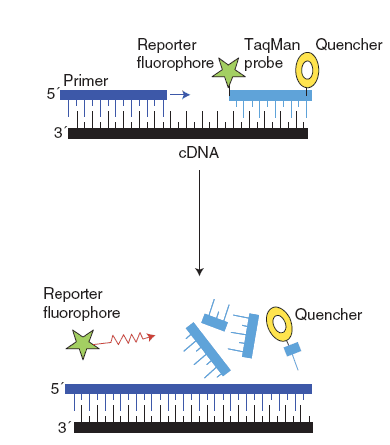
(2) Hydrolysis probes (TaqMan®)
TaqMan® has a fluorescent reporter dye attached to its 5’ end and a quencher dye at its 3’ end. The primer and TaqMan probes annealing to the DNA template simultaneously. After the extension phase, TaqMan was cleaved by DNA polymerase, which results in the 5’ end fluorescent reporter dye of TaqMan is separated with 3’ end quencher dye and fluorescence is detected.
2. Parameter
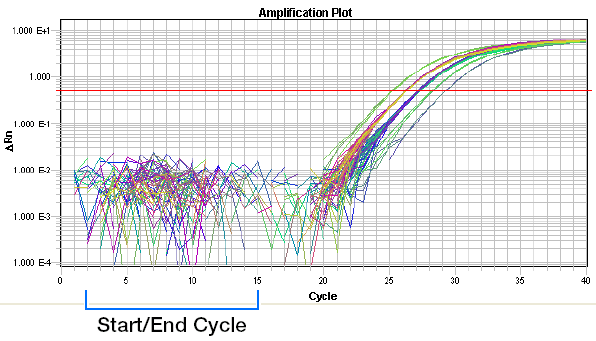
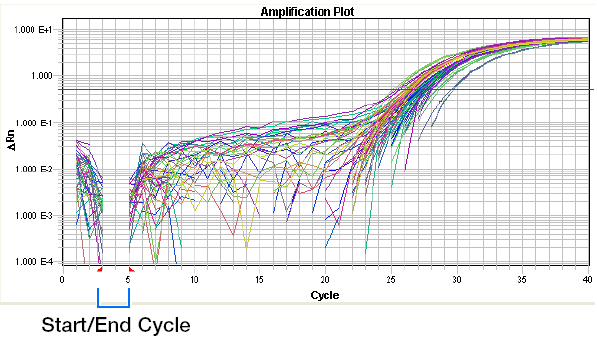
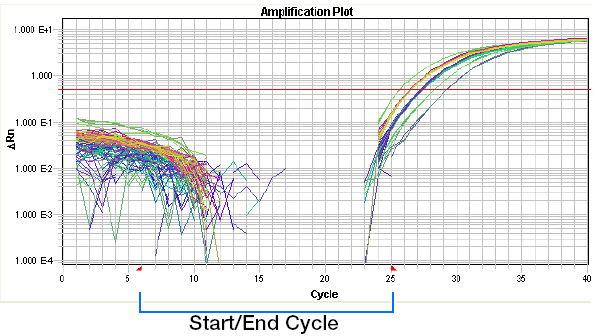
(1) Baseline: the baseline is a critical line when a reporter fluorescent signal is accumulating but not reaching the limits of detection of the instrument. Computer software sets the baseline from cycles 3~15 usually according to PCR cycles.
(2) △Rn :Rn = Rnf – Rnb. Rnf is the fluorescence emission of the product at each time point; Rnb is the fluorescence emission of the baseline. △Rn is a dynamic value based on each PCR cycle.
(3) Threshold: a threshold is chosen by computer softwares based on variability of the baseline. A fluorescent signal that is detected above the threshold is believed a real signal that can be used to define the threshold cycle (Ct) of a sample.
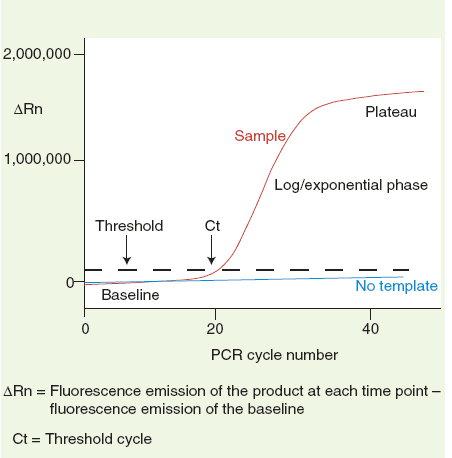
(4) Ct: Ct value is PCR number at which the reporter fluorescence is greater than the minimal detection level. It is a basic and essential component for data analysis.
3. Housekeeping gene
The most common genes used for housekeeping genes are β-actin, GAPDH and ribosomal RNA (rRNA).
4. Absolute quantitation & Relative quantitation
(1) Absolute quantitation
Quantitation the unknown samples is measured by Ct value and the standard curve. The most common method is using a plasmid for the target gene and the standard curve generated by a serial dilution of a starting amount. The standard curve method is used when absolute quantitation is critical or in quantitation of viral load.
(2) Relative quantitation
Relative quantitation is also known as the comparative threshold method (2-△△Ct method). This method is used to calculate the relative expression levels of a target relative to a reference control. The amount of target gene given by 2-△△Ct in the sample is normalized to a housekeeping gene and relative to the normalized calibrator. △Ct = Ct (target gene) – Ct (housekeeping gene), △△Ct = △Ct (sample) - △Ct (calibrator).
EQUIPMENT
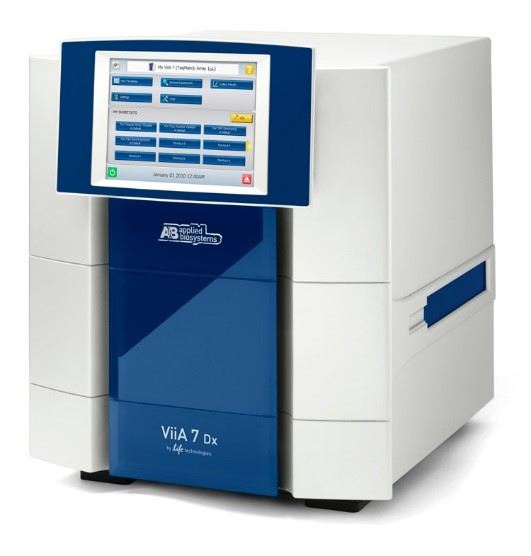
Real-time qPCR instrument
Centrifuge
SUPPLIES
DNA/cDNA: 10 ng~100 ng
2×PCR mix
PCR grade water
Forward and reverse primers: 10 μM
25 mM MgCl2
Reference dye
Specific target detection probes
Sterile filter pipette tips
Sterile 1.5mL centrifuge tubes
96/384-well PCR plates
METHOD (Specific to SYBR ® Green assays)
1. Reverse transcription
RT reaction mix:
| Reactions | Target final concentration | Volume per tube |
| RNase-free water | variable | 3.85 μL |
| 10×TaqMan RT buffer | 1× | 1.0 μL |
| 25 mM MgCl2/td> | 5.5 mM | 2.2 μL |
| dNTP (2.5 mM) | 500 μM per dNTP | 2.0 μL |
| Random Hexamers (50 μM) | 2.5 μM | 0.5 μL |
| RNase Inhibitor (20 U/L) | 0.4 U/μL | 0.2 μL |
| MultiScribeTM Reverse Transcriptase (50 U/μL) | 1.25 U/μL | 0.25 μL |
| Total 10 μL |
RT reaction parameters:
| Temp | Time | |
| Incubation | 25°C | 10 min |
| RT | 48°C | 30 min |
| Reverse Transcription Inactivation | 95°C | 5 min |
| Hold | 4°C | ∞ |
(1) Prepare the RT reaction Mix by combining all the nonenzymatic components.
(2) Vortex briefly.
(3) Add the enzymatic components and the RNA.
(4) Mix the components by inverting the microcentrifuge tube.
(5) Transfer the contents to a MicroAmp® Optical Tube or Plates.
(6) Cap the tubes or plates with MicroAmp® Optical Caps.
(7) Centrifuge the tubes briefly to remove air bubbles and collect the liquid at the bottom of the tube.
(8) Transfer the plates to the thermal cycler block.
(9) Perform RT.
(10) Remove the plates after thermal cycling is complete.
2. Real-time quantitative PCR
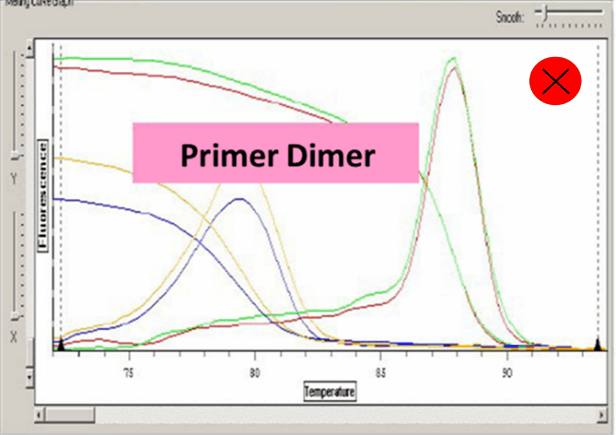
(1) Design and synthesize primers. There are many primer design computer software such as Oligo, PrimerPremier and DNA man. The amplicon for the PCR product should be as small as reasonably possible, usually <300 bp in length for designs. Shorter amplicons amplify more efficiently and are more tolerant of reaction conditions. The PCR primers must not form an appreciable amount of primer-dimer bands.
(2) Put all reaction components on ice to melt, pay attention to placing the reference probe dye to avoid light.
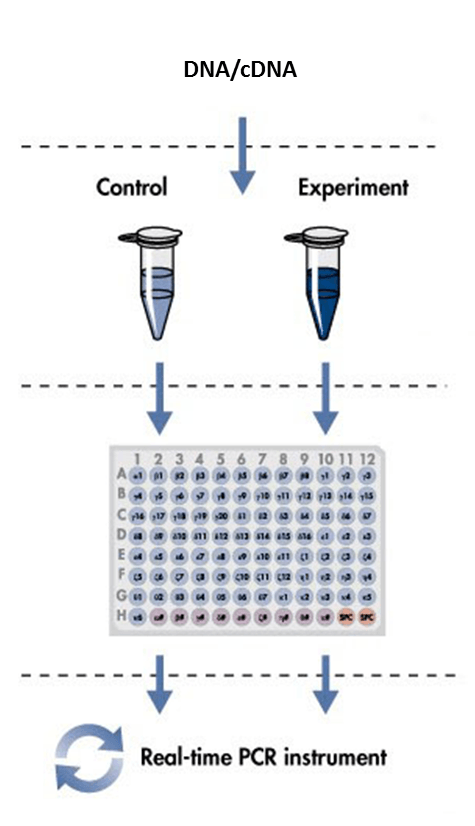
(3) Calculate the number of reactions, including internal references, no templates controls (NTC) and repetitions. Design the places of different reactions.
(4) Prepare the reference probe dye mixture and the primers mixture according to the different reaction numbers and reaction systems (20 uL reaction system).
(5) Add appropriate dose of 2×PCR mix and 25 mM MgCl2 into step 4 mixture. Prepare a master mix for all reactions.
Master mix for real-time qPCR reagent with separate components:
| Reactions | Target final concentration | Volume per single 15 μL |
| 2×PCR mix | 1× | 7.5 μL |
| Forward primer (10 μM) | 0.2 μM | 0.3 μL |
| Reverse primer (10 μM) | 0.2 μM | 0.3 μL |
| 25 mM MgCl2 | 3.5 mM | 2.6 μL |
| Reference probe dye | X μL | |
| PCR grade water | Total 15 μL |
(6) Add 5 μL water to the NTC reaction wells. Make sure that there are at least two NCT wells.
(7) Add 5 uL DNA/cDNA templates to appropriate wells with same concentration.
(8) Add 15 uL probe, primers and master mix mixture prepared from step 5 into reaction wells.
(9) Seal the 96/384-well PCR plates with plastic film. Mark the different reaction wells on the film. Make sure that the marker does not impact the qPCR instrument detection.
(10) Gently vortex the PCR plates to make sure the components are mixed evenly.
(11) Centrifuge the PCR plates briefly and check that all wells contain samples at the bottom of wells.
(12) Run samples according to the appropriate parameters on qPCR instrument.
Standard cycling parameters:
| Temp | Time | Cycles | |
| Initial denaturation | 94°C | 2 min | |
| Denaturation | 94°C | 15 sec | 40 cycles |
| Annealing | 5°C below lowest primer TM | 1 min | |
| Extension and read fluorescence | 72°C | 1 min per kb | |
| Hold | 4°C | ∞ |
(13) Analyze the cycle data by computer software Excel and SDS 2.4 etc. Pay attention to the dissolution curve and make sure that there is only one peak of each well.
△Ct = Ct (target gene) – Ct (housekeeping gene)
△△Ct = △Ct (sample) - △Ct (calibrator)
Real-time qPCR value = 2-△△Ct
Ct value can be adopted when the dissolution curve have one peak:
Baseline set correctly:
Baseline set too low:
Baseline set too high:
NOTES:
1. RNA for real-time qPCR reaction should avoid DNA interfusion. RNA extraction and reverse transcription processes should be cautious.
2. Real-time qPCR experimental should be operated on the ice with avoiding light.
3. cDNA template should avoid repeated freezing and thawing, otherwise it will cause the degradation of the cDNA template.
4. Lack or degradation of template result in CT values not appear or appear too late. qPCR should be start from the highest concentration of diluted sample series for concentration unknown samples.
5. Template should be moderately dilute before added to the reaction system to improve the efficiency of amplification. But the repeatability of results become worse when the concentration of template is too low.
6. Amplified fragments should not be too long, 80-300 bp is enough. Annealing temperature should be above 60℃. Pay attention to avoid primer dimers and nonspecific amplification.
7. Too high concentration of primer or primer dimers will cause dissolution curve appears more than one main peak.
8. Set negative control and prevent water and master mix from pollution.