Uncategorized Thursday, 2025/06/05
With the advancement of biotechnology, an increasing number of insulin analogues have been developed. To ensure the quality and safety of these drugs, comprehensive analyses are required. This article reviews various analytical methods for human insulin and its analogues, including structural analysis, impurity analysis, and biological activity analysis.
Structure of Human Insulin and Its Analogues
Structure of Human Insulin
Human insulin consists of two chains, A and B, comprising a total of 51 amino acids: 21 in the A chain and 30 in the B chain. The two chains are connected by two disulfide bonds, with an additional disulfide bond within the A chain.
The 3D structure of insulin is crucial for its biological function. Its structural characteristics determine how it binds to receptors and the subsequent signaling process.
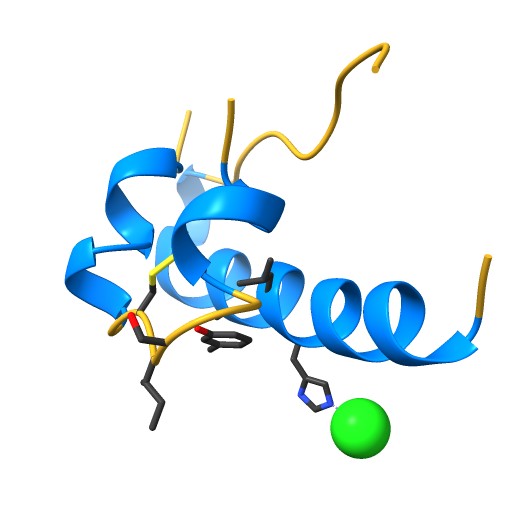
NIH 3D - STRUCTURE OF INSULIN
Structural Characteristics of Insulin Analogues
Insulin analogues are typically derived by modifying the amino acid sequence of human insulin. These modifications can alter the pharmacokinetics and biological effects of insulin.
For example, in insulin glargine, the asparagine at position 21 of the A chain is replaced by glycine, and two extra amino acids, arginine (B₃₁) and arginine (B₃₂), are added at the C-terminal of the B chain. Insulin aspart involves replacing the proline at position 28 of the B chain with aspartic acid, while insulin lispro involves switching the positions of proline and lysine at positions 28 and 29 of the B chain.
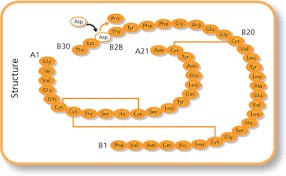
Insulin aspart (from wikipedia)
Structural Analysis Methods
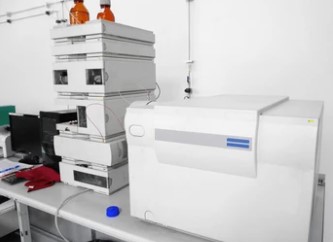
Liquid Chromatography-Mass Spectrometry (LC-MS/MS)
Principle
LC-MS/MS combines the separation capability of liquid chromatography with the identification ability of mass spectrometry. Liquid chromatography can separate complex samples, and then mass spectrometry can identify the mass and structure of the separated components.
Liquid Chromatography (LC):
Separation: The sample is dissolved in a mobile phase and injected into an LC column packed with a stationary phase. Components separate based on differential interactions (e.g., polarity, size) with the stationary and mobile phases.
Output: Individual analytes exit the column sequentially (elution) as discrete peaks, reducing matrix interference and enabling analysis of complex mixtures.
Ionization (MS1 Stage):
Ionization Techniques: Analytes are ionized using methods like electrospray ionization (ESI) or atmospheric pressure chemical ionization (APCI), converting neutral molecules into charged ions.
Ionization Purpose: Charged ions are necessary for mass spectrometric analysis, as they can be directed and detected by electric and magnetic fields.
First Mass Analysis (MS1):
Mass Analyzer: A mass analyzer (e.g., quadrupole, TOF) separates ions by their mass-to-charge ratio (m/z). This stage identifies precursor ions (intact molecules) present in the sample.
Fragmentation (MS/MS Stage):
Ion Selection: Specific precursor ions are isolated in the first mass analyzer (e.g., via a quadrupole).
Collision-Induced Dissociation (CID): Selected ions are fragmented in a collision cell using inert gas (e.g., nitrogen), breaking chemical bonds and generating smaller product ions.
Second Mass Analysis (MS2):
Fragment Analysis: The second mass analyzer detects and quantifies product ions from the fragmented precursor, producing a characteristic spectrum (fragmentation pattern).
Data Interpretation:
Identification: The m/z of precursor and product ions, along with their relative abundances, are compared to spectral databases or standards to confirm compound identity.
Quantification: Calibration curves using standards enable precise quantification of analytes in complex matrices.
Workflow Summary:
Sample → LC Separation → Ionization → MS1 (Precursor Ion Selection) → Fragmentation → MS2 (Product Ion Analysis) → Data Analysis.
In the analysis of human insulin and its analogues, reverse-phase liquid chromatography is typically used with a water-acetonitrile mobile phase mixture and additives like formic acid to improve separation and ionization efficiency.
Application Example
Xin Yue Hu et al. developed a method employing Ultra-Performance Liquid Chromatography-Tandem Mass Spectrometry (UPLC-MS/MS) for determining the full sequence of human insulin and its analogues. This method involves a pre-treatment with reduction and alkylation, followed by UPLC-MS/MS analysis, using an ACQUITY UPLC peptide BEH C₁₈ (100 mm×2.1 mm, 1.7 μm, 300Å) column. The mobile phase A was 0.1% formic acid in water, and mobile phase B was 0.1% formic acid in acetonitrile, using gradient elution. By optimizing mass spectrometry parameters, they achieved top-town full-sequence analysis of human insulin and its analogues. This method effectively covered the full sequences of insulin A and B chains, and could distinguish between different insulin analogues with good specificity, suitable for insulin aspart and insulin lispro.
Peptide Mapping Analysis
Principle
Peptide mapping analysis involves first extracting and purifying target proteins, followed by denaturation, reduction, and enzymatic hydrolysis to cleave the protein into peptide fragments. Subsequently, techniques like high-performance liquid chromatography (HPLC) are employed to separate these peptide fragments. The separated peptides are then analyzed using methods such as mass spectrometry to determine their molecular weight and infer amino acid sequences. Finally, by comparing the obtained peptide map with a theoretical map or a reference standard, the protein's primary structure, including its sequence and post-translational modifications, is characterized. This method is commonly used for protein identification, characterization, and quality control.
Application Example
Lv Yin Wang et al. studied the peptide mapping analysis method for insulin glargine. Through specific enzymatic digestion, insulin glargine was broken down into peptides, then separated and analyzed by liquid chromatography. Comparing with reference peptide maps, they could detect structural correctness and identify impurities or degradation products.
Related Protein
| Cat.No. # | Product Name | Source (Host) | Species | Tag | Protein Length | Price |
|---|---|---|---|---|---|---|
| INS-315H |
Recombinant Human Proinsulin protein

|
E.coli | Human | Non | 25-110 aa | |
| INS-623C | Recombinant Full Length Cynomolgus Monkey insulin Protein, His tagged | HEK293 | Cynomolgus | His | Full L. 25-110 aa | |
| INS-623CE | Recombinant Full Length Cynomolgus Monkey insulin Protein, His tagged | E.coli | Cynomolgus | His | Full L. 25-110 aa | |
| INS-14H |
Active Recombinant Human Insulin, Low Endotoxin, Media Grade
|
E.coli | Human | Non |
|
|
| INS-256H |
Active Recombinant Human Insulin
|
Human | S.cerevisiae | Non |
|
|
| INS-320H |
Active Recombinant Human INS protein
|
Yeast | Human | Non | 1-29 aa & 1-21 aa |
|
| INS-607H |
Active Recombinant Human INS, Met, His&Lys-tagged
|
E.coli | Human | His | 25-110 a.a. |
|
Impurity Analysis Methods
Reverse-Phase High-Performance Liquid Chromatography (RP-HPLC)
Principle
RP-HPLC separates compounds based on differences in partition coefficients between the stationary and mobile phases. In the impurity analysis of human insulin and its analogues, C₁₈ chromatography columns are commonly used, and the mobile phase consists of a buffer and an organic solvent mixture.
Application Example
Xiao Li Ding et al. optimized the impurity analysis method for insulin glargine injection. They used a Thermo Scientific Bio-Basic-C₁₈ column (250 mm×4.6 mm, 5 μm) with sodium chloride-phosphate buffer-acetonitrile as mobile phases A and B in gradient elution at a flow rate of 1.0 mL∙min⁻¹, detection wavelength of 214 nm, and column temperature of 35℃. The method validation showed good results, effectively separating and accurately measuring impurities in samples. The main impurity in insulin glargine injection was identified as 3B-succinimide-insulin glargine, resulting from NH₃ degradation of asparagine at position 3 of the B chain.
LC-MS in Impurity Identification
Principle
LC-MS allows the separation and concurrent structural identification of impurities. Analyzing mass spectrometry data can provide insights into the molecular weight and possible structure of impurities.
Application Example
In the impurity analysis of insulin glargine injection, components with the highest impurity content were collected using RP-HPLC and identified with LC-MS. The chromatographic column used was ACQUITY UPLC BEH C₁₈ Column (100 mm×2.1 mm, 1.7 μm, 300Å), with a mobile phase A of 0.1% formic acid in water and mobile phase B of 0.1% formic acid in acetonitrile, employing gradient elution, and a column temperature of 50℃. Mass spectrometry data acquisition was conducted in MSE mode with a first-order mass energy of 40V. LC-MS analysis identified the main impurity as 3B-succinimide-insulin glargine.
Related Products & Services
- PROTAC Targets
- Cell and Gene Therapy
- Targets of CAR-T Cell Therapy
- Cancer Drug Targets
- Immune Checkpoint Proteins
- Protein Engineering Services
- Protein Interaction Service
- Protein Expression and Purification Services
- Drug Discovery Screening
- Protein Pathway Profiling
References
- Hu X Y, Ding X L, Chen Y, Zhang H, Li J, Liang C G. Full sequence analysis of human insulin and its analogs by UPLC-MS/MS [J]. Chinese Journal of Pharmaceutical Analysis, 2022,42(1):13-22. DOI:10.16155/j.0254-1793.2022.01.02.
- Ding X L, Chen Y, Hu X Y, et al. Study on the analysis method of related substances in insulin glargine injection [J]. Chinese Journal of Pharmaceutical Analysis,2022,42(1):23-32. DOI:10.16155/j.0254-1793.2022.01.03.
- Yang Y F, Wang L Y, Liang Y L, et al. Determination of the biological activity of human insulin by time-resolved fluoroimmunoassay [J]. Chinese Journal of Pharmaceutical Analysis,2022,42(1):51-59. DOI:10.16155/j.0254-1793.2022.01.06.