
Principle and Protocol of the PRO-Q Diamond Staining
The Pro-Q Diamond fluorescent dye introduced here is specially designed for phosphorylated protein dyeing. In 2003, Wavne Patton of Molecular Probes reported a new fluorescent dye, Pro-Q Diamond, which can specifically dye phosphorylated groups (linked to tyrosine, serine or threonine residues). This method is convenient, fast and highly sensitive, with a linear range of more than 3 orders of magnitude, and is compatible with mass spectrometry identification. The excitation light wavelength of Pro-Q Diamond is 488 mm, and the absorption peak wavelength is 532 mm. After that, the researchers of the company also spot some proteins and peptides on the protein chip, and use Pro-Q Diamond to test the phosphorylation level of proteins and peptides on the chip, with a sensitivity of 312~625 fg. The combination of this chip and dye provides a good platform for the research of signal pathway and phosphatase inhibition.
After Pro-Q Diamond phosphorylated protein staining for the same glue, SYPRO Ruby fluorescent dye can also be used to dye the total protein; The advantages of simultaneous detection of phosphorylated protein and total protein on the same gel make the application of these two reagents popular. The limit of protein detection by SYPRO is 0.25~1 ng, and the linear range is more than 3 orders of magnitude. It combines with basic amino acids and polypeptide main chains, so the difference between different proteins is small, and more accurate quantification can be carried out. Its staining range includes glycoproteins, phosphorylated proteins, lipoproteins, calcium-binding proteins and other proteins that are difficult to stain. It will not be over-stained and will not interfere with subsequent mass spectrometry analysis and Edman sequencing. Its detection operation is also very simple. It can be fixed twice, dyed and decolored. SYPRO has two excitation peaks with wavelengths of 280 nm and 450 nm, and the emission peak wavelength is 610 nm. Ultraviolet transmission instrument, blue light transmission instrument or laser scanner can observe the dyed protein. These two reagents are convenient to use, but they are not cheap.
The protein samples for staining analysis can be carried out on SDS-PAGE gel or on SDS-PAGE gel of two-dimensional electrophoresis. This section takes dyeing on two-dimensional electrophoresis gel as an example.
The purpose of this experiment manual is to help scientific researchers master the basic principles and main steps of Pro-Q Diamond fluorescent dye to detect phosphorylated protein and SYPRO fluorescent dye to detect total protein, and understand the application of Pro-Q Diamond fluorescent dye to detect phosphorylated protein and SYPRO fluorescent dye to detect total protein.
Protein phosphorylation is an unstable dynamic process in vivo, and the intracellular abundance of phosphorylated protein is low. These characteristics make it difficult to dye phosphorylated proteins. Pro-Q Diamond fluorescent dye can specifically bind with phosphorylated serine, threonine and tyrosine. The protein after Pro-Q Diamond staining was scanned at 488 nm wavelength (excitation) and 532 nm wavelength (absorption light). The total protein extracted by direct electrophoresis and dyed with Pro-Q Diamond dye can reduce the loss of protein generated by operation and phosphorylation. In addition, SYPRO dye can also re-stain the total protein on the gel after Pro-Q Diamond dyeing. SYPRO combines with basic amino acids and polypeptide backbone, so the difference between different proteins is small, and more accurate quantification can be carried out. Its staining range includes glycoproteins, phosphorylated proteins, lipoproteins, calcium-binding proteins and other hard-to-stain proteins. Under the excitation (280 nm and 450 nm) and emission (610 nm) of SYPRO, the dyed protein can be observed by ultraviolet transmission instrument, blue light transmission instrument or laser scanner. This staining method is convenient for the analysis of phosphorylated protein and total protein on the same piece of gel.
The first direction of two-dimensional electrophoresis is isoelectric focusing electrophoresis, and the proteins are separated along the pH gradient to their respective isoelectric points; Then, carry out SDS-PAGE in the vertical direction to separate the proteins according to their relative molecular weight, so that different proteins can be separated as much as possible.
In the past two years, fluorescent dyes have been used in the analysis of total phosphorylated proteins in rice and cabbage. Therefore, in this section, the expression of phosphorylated protein and total protein was analyzed by using Pro-Q Diamond fluorescent dye after extracting total protein and two-dimensional electrophoresis.
1. Main Instruments and Equipment
Micro-pipette, centrifuge, two-dimensional electrophoresis system, low fluorescence glass plate, circulating water bath, decolorization shaking table, Typhoon scanner, ImageMaster 2D Platinum version 5.0 software.
2. Material
Turnip root bark.
3. Main reagents
(1) Phenol extract solution
| 0.9mol/L | Sucrose |
| 0.5mol/L | Tris-Base |
| 0.05 mol/L | EDTA |
| 0.1mol/L | KCl |
| 2% | β- Mercaptoethanol *1 |
(2) SDS extraction solution
| 1.175 mol/L | Tris |
| 5% | SDS |
| 0.03 mol/L | DTT |
(3) Tris-HCl extraction solution
| 50 mmol/L | Tris-HCl (pH 8.0) |
| 5mmo/L | EDTA |
| 20 mmol/L | DTT |
| 100mmol/L | KCl |
| 2mmol/L | PMSF |
(4) TCA-acetone extraction solution*2
| 10% | TCA |
| 1% | Acetone of DTT |
(5) Cracking liquid of direct cracking method *3
| 7mol/L | Urea |
| 2mol/L | Thiourea |
| 4% | CHAPS |
| 1% | DTT*4 |
| 2% | Ampholyte (pH3-8) *4 |
(6) Hydration solution
| 8mol/L | Urea |
| 2% | CHAPS |
| 20 mmol/L | DTT*3 |
| 0.5% or 2% | IPG buffer*4 |
| A little | Bromophenol blue |
(7) Balance buffer*5
| 6mol/L | Urea |
| 75mmol/L | Tris-HCl (pH 8.8) |
| 29.3% | Glycerin (87%) |
| 2% | SDS |
| A little | Bromophenol blue |
(8) Bind-silane working solution*6
| 3.2mL | Ethanol |
| 80μL | Glacial acetic acid |
| 4μL | Bind-silane |
| 0.72mL | Deionized water |
(9) Capped agarose solution
| 0.2% | Agarose |
| 0.002% | Bromophenol blue |
(10) Stationary solution
| 40% | Methanol |
| 10% | Glacial acetic acid |
(11) Pro-Q Diamond decolorizing solution
| 25% | Acetonitrile |
| 50mmo/L | Glacial acetic acid (pH4.0) |
(12) SYPRO decolorizing solution
| 40% | Methanol |
| 7% | Glacial acetic acid |
(13) Tris-glycine electrophoresis buffer
(14) 2-D Clean-up kit
(15) 2D-Quant kit
1. Reducing protein and blocking cysteine
(1) 0.15g of powder was added to 700μL of extraction solution and mixed rapidly.
(2) Add an equal volume of saturated phenol and mix gently for 10min.
(3) Centrifuge at 0.4°C and 2500g for 10min, and aspirate the upper phenol phase.
(4) The remaining pquid was re-extracted with 700μL of saturated phenol, and the phenol phase was aspirated again.
(5) Combine the two extracted phenol phases in a 10 mL tube, add 5 times the volume of precipitation solution (containing 0.1 mol/L ammonium acetate and methanol solution containing 2% β-mercaptoethanol), -70°C overnight precipitation or precipitation for 2h (modified phenol method).
(6) Centrifuge at 10 000 g for 30 min, and the precipitate was washed three times with pre-chilled precipitation solution and 70% ethanol, respectively, to fully suspend the precipitate when washing the precipitate.
(7) The resulting precipitate was dried to powder in a freeze-vacuum drier and set aside.
2. The procedure of protein preparation by SDS method
(1) 0.15g of powder was added to 700μL of extraction solution and mixed gently for 20min.
(2) Transfer to a 10mL tube, add 4 times the volume of acetone pre-cooled at -20°C, and mix well.
(3) Centrifuge at 15000g for 20min at 4°C and discard the supernatant.
(4) Wash the precipitate with 80% acetone pre-cooled at -20°C until colorless.
(5) After centrifugation, the supernatant was discarded and the precipitate was dried to powder in a freeze vacuum drier.
3. The procedure of protein preparation by Tris-HCl method
(1) 0.15g of powder was added to 700μL of extraction solution and mixed gently for 20min.
(2) Leave it at 4°C for 30min.
(3) Centrifuge at 15000g for 20min and aspirate the supernatant in a 10mL tube.
(4) The precipitate was re-extracted once and the 2 supernatants were combined.
(5) Add 5 times the volume of acetone pre-cooled at -20°C, mix well, and precipitate for 2h at -20°C.
(6) Centrifuge at 15,000g for 20 min at 4°C and discard the supernatant.
(7) Wash the precipitate 3 times with 80% acetone pre-cooled at -20°C, and dry the precipitate to powder in a freeze dryer.
4. The procedure of protein preparation by the TCA-acetone method
(1) 0.15g of powder was added to 700μL of extraction solution, mixed well and placed at -20°C for 2h.
(2) Centrifuge at 15000g for 20min at 4°C.
(3) The precipitate was washed with pre-cooled 80% acetone containing 1% DTT at -20°C until colorless.
(4) Freeze-dry the precipitate to powder in a freeze-vacuum drier and reserve.
5. The procedure of protein preparation by direct lysis method with lysate
(1) Add 0.15g of powder to 500μL of lysis solution, mix gently and dissolve at room temperature for 2h.
(2) Centrifuge at 15000g for 20min at 4°C, and take the supernatant in a new tube and reserve.
6. Protein lysis methods
(1) The proteins extracted by each of the above methods were precipitated by lysis with 100μL of lysis solution at room temperature.
(2) Centrifuge at 15000g for 20min at 15°C to remove the undissolved fraction.
(3) Store at -40°C for backup.
7. Protein purification
Phosphorylated proteins are present in low abundance in the sample and to reduce the effect of impurities and ions on bidirectional electrophoresis, the sample is purified using a 2-D Clean-up kit.
(1) The lysed protein sample was transferred into a centrifuge tube.
(2) Add 3 times the volume of precipitant and mix well, ice bath (4-5°C) for 15min.
(3) Centrifuge at 8000g for 10min and remove the supernatant. Wash the precipitate once with a sedimentation aid.
(4) Thoroughly remove the supernatant, add deionized water without precipitate, and dissolve the precipitate.
(5) Add 1 mL of wash buffer pre-chilled at least 1 h at -20°C.
(6) Add 5μLof wash additive and shake until the precipitate is completely dispersed.
(7) Place the tube at -20°C for at least 30 min and shake for 20-30 s every 10 min.
(8) Centrifuge at 8000g for 10 min and remove the supernatant. Add lysis solution (volume 1/5 of the initial volume) to dissolve the sample.
8. Protein quantification
The phosphorylated protein content is a small percentage of the total protein, so the accuracy of quantification is required. Here we use 2D-Quant kit for quantification.
(1) Prepare the standard curve according to the following table.
| Sample tube No | 1 | 2 | 3 | 4 | 5 | 6 |
| Required volume of 2mg/mL BSA standard protein/ μL | 0 | 5 | 10 | 15 | 20 | 25 |
| Protein quality/ μg | 0 | 10 | 20 | 30 | 40 | 50 |
(2) Prepare 10μL and 2μL of standard protein BSA control and 10μL and 2μL of samples respectively (so that the unknown protein concentration pes within the pnear interval).
(3) Add 500μLof precipitant to all samples, vortex and mix, and let stand at room temperature for 2min.
(4) Add 500μL of sedimentation aid, vortex and mix well.
(5) Centrifuge at 10 000g for 5min.
(6) Remove the supernatant thoroughly.
(7) Add 100μL copper solution and 400μL deionized water to each tube and vortex to dissolve the precipitated protein.
(8) Add 1mL of working color reagent (working color reagent), making sure to mix by inverting quickly after adding the color reagent.
(9) Let stand at room temperature for 15-20 min. measure the concentration with a spectrophotometer.
9. Total protein assay
The results of SDS-PAGE electrophoretic detection and concentration determination of total proteins extracted by six methods (Figure 7-2-11).
Staining was performed using SYPRO fluorescent dye:
(1) Fixation in fixative solution for 3h*11.
(2) Wash once with Milp-Q deionized water and then add 500mLSYPRO fluorescent staining solution and stain for 3h.
(3) Recover the staining solution and wash with SYPRO eluent for 1h to help remove the non-specific spots, and Milp-Q deionized water wash can be used to acquire images.
10. Analysis of results
The results showed that equal amounts of materials and extracts were obtained with the highest yield by the phenol method, followed by the SDS method and Tris-HCl method, and the worst by the TCA-acetone method and direct lysis with lysate.
The same volume of protein lysate (10μL) was subjected to SDS-PAGE, and the results showed that the phenol method had more bands than the SDS and Tris-HCL methods, while the samples from the TCA-acetone and lysate direct lysis methods had no bands. Although the phenol method samples had more bands, many of them were not clear, while the bands were clear in the modified phenol method samples and the yields were not significantly affected*12 (Table 17-2-1).
Figure 7-2-1 Comparison of SDS-PAGE profiles of total protein of turnip root bark obtained by six different extraction method
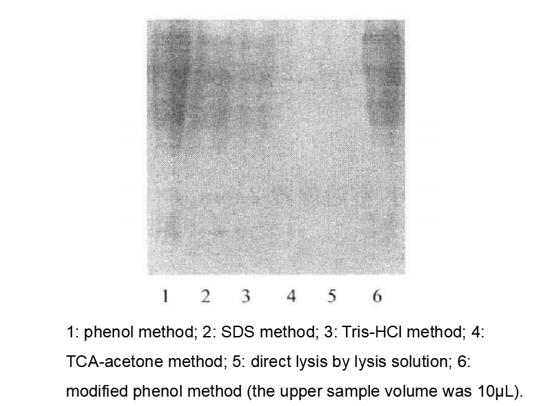
Table 7-2-1 Concentrations and yields of total protein of turnip root bark obtained by six different extraction methods
| Extraction methods | Concentration/ (μg/μL) | Protein yield/ (μg/g) |
| Phenol method | 1.62 | 1080 |
| SDS method | 1.16 | 773 |
| Tris-HCl method | 1.08 | 720 |
| TCA-acetone method | 0.26 | 173 |
| Direct lysis by lysis solution | 0.24 | 160 |
| Modified phenol method | 1.59 | 1060 |
The concentration displayed by the direct pyrolysis method is the measured concentration × 5.
11. Two-dimensional Electrophoresis
(1) Electrophoresis
First-way isoelectric focusing electrophoresis was performed using 24 cm gel strips from Amerson Biosciences, pH 3-11, with a loading volume of 1000μg*13 and a loading volume of 450μL.
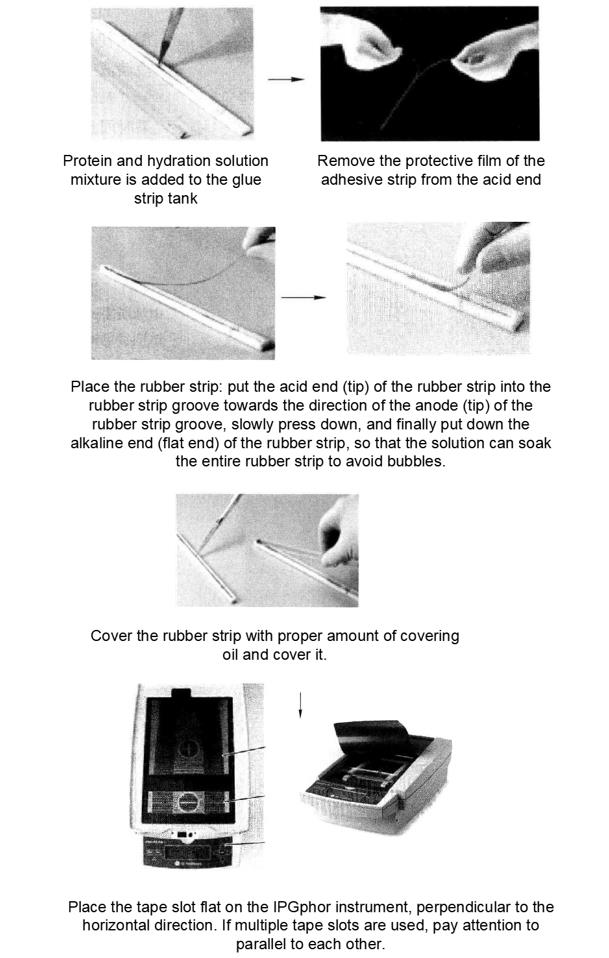
Ettan IPGphor from Amersham Biosciences was used for first-way isopoint focusing.
| Voltage / V | Boost mode | Electrophoresis time/h |
| 30 | step-n-hold | 12 |
| 100 | step-n-hold | 1 |
| 1000 | step-n-hold | 1 |
| 8000 | gradient | 2 |
| 8000 | step-n-hold | 55000 Vh*14 |
| 500 | step-n-hold | 5 |
(2) Equilibration of one-to-two-way adhesive strips*15
Place the gum strips into 10mL equilibration buffer I (containing 1% DTT), seal, and shake on a shaker for 15min*16.
Take out the gum strip into 10mL equilibration buffer II (containing 2.5% iodoacetamide), seal, and shake on a shaker for 15min*15.
Rinse the gum strips with deionized water for 1 s. Place the edges of the gum strips on filter paper for a few minutes to remove excess liquid.
(3) Two-way electrophoresis
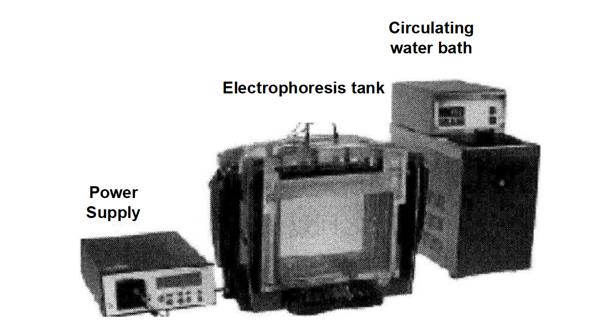
Prepare the separation gel and perform electrophoresis by controlling the electrophoresis conditions. Please refer to the relevant part of Module 4 for the specific gel preparation process.
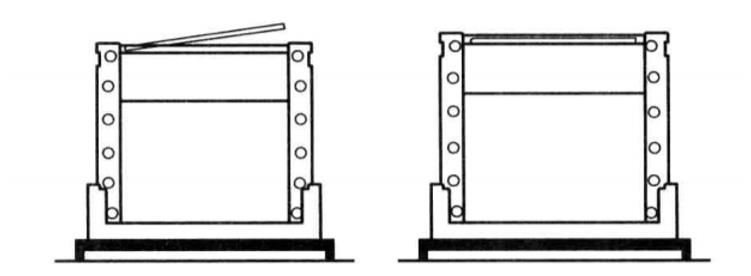
No comb needs to be inserted for gel preparation, only the gel buffer needs to be injected to form a flat gel surface*17.
The equili/pated gel strip is dipped into the electrophoresis buffer for a few seconds, transferred to the prepared second-way SDS gel, and the strip is gently pressed to fully bind to the SDS gel surface. It is then capped with agarose to prepare for second-way electrophoresis.
The electrophoresis running conditions are.
| 3 W/gel | 45min |
| 17 W/gel | to bromophenol blue to the bottom of gel |
The electrophoresis temperature was 16°C.
12. Pro-Q Diamond and SYPRO fluorescent staining
(1) Pro-Q Diamond staining
After electrophoresis, the gel was placed in a polypropylene plastic box and fixed with fixative for 3h.
The gels were washed 3 times with Milli-Q deionized water for 20 min each.
After washing with water, 500mL of Pro-Q Diamond was added, shaken on a shaker, stained for 1h, and the staining solution was recovered*19.
Wash 3 times with decolorization solution for 30 min each.
After that, wash 3 times with Milli-Q deionized water for 10 min each.
After that, images can be acquired with a Typhoon 9400 fluorescence scanner (Figure 7-2-2)*20
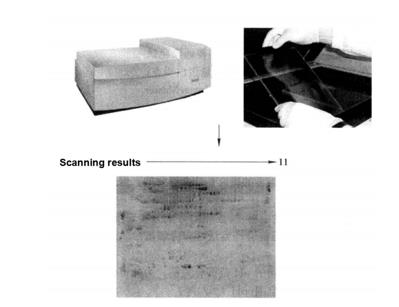
Figure 7-2-2 SDS-PAGE electrophoresis map of total protein in turnip root bark (results of total phosphorylated protein stained by Pro-Q Diamond). Using IPG (pH3~11) 24cm adhesive strip as the first direction and 12.0% SDSPAGE as the second direction to isolate total protein.
(2) SYPRO fluorescence staining
After Pro-Q Diamond staining, the gel was scanned and washed once with Milli-Q deionized water.
Add 500mLSYPRO fluorescent staining solution and stain for 3h*21.
The staining solution was recovered and the gel was washed with SYPRO eluent for 1h to help remove non-specific spots.
After the Milli-Q deionized water wash, images can be acquired with the Typhoon 9400 fluorescence scanner (Figure 7-2-3).
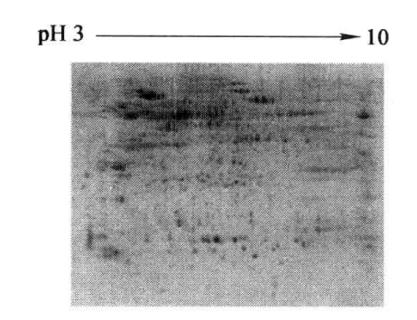
Figure 7-2-3 SDS-PAGE electrophoresis profile of total turnip root bark protein (results of secondary staining by SYPRO)
13. Analysis of staining results
The results of both Pro-Q Diamond and SYPRO fluorescence staining are similar to those obtained after staining scans with common staining reagents such as Komas Brilliant Blue. After acquiring gel images, adjusting and calibrating gel images; quantifying protein spots; matching gel images; analyzing differential proteins, integrating data, and reporting results. All of this is done in ImageMaster 2D Platinum version 5.0.
1. Obtaining high-purity phosphorylated proteins is essential for phosphoproteomics research. However, there are many steps in the extraction process that can affect the purity of proteins and require special attention.
2. It is important to consider whether the protein can be effectively solubilized by making full use of denaturants, surfactants, amphoteric electrolytes, reducing agents and other components, and also to consider the extraction time, which is too long for the released protease to become active and degrade the protein. These are critical steps to obtain high purity proteins.
3. The number of protein spots detected may also be related to the amount of the sample and the pH range of the adhesive strip used. For this reason, it is possible to choose a gel strip with a suitable pH range, such as a small pH range (pH 4-7), depending on the characteristics of the phosphorylated protein distribution.
4. The influence of the settings of the parameters of bidirectional electrophoresis on the test results should also be noted.
*1 Add before use.
*2 Pre-cooled at -20°C before use.
*3 For turnip root bark containing more polysaccharides and secondary metabolites, different methods are used to extract proteins and the most suitable method is selected for bulk extraction for subsequent operation (total 5 extraction methods).
*4 DTT and IPG buffer should be added before use.
*5 Before use, add 1% DTT (100mg/10mL) or 2.5% iodoacetamide (250mg/10mL) in a certain amount for the first equili/pation and the second equili/pation, respectively.
*6 The preparation of the solution should be done in a fume hood. This 4mL can coat a glass plate 3 times. Because the staining scan process moves the gel several times to avoid gel /peakage, fix the gel on the glass plate.
*8 Phosphorylated proteins are mainly concentrated at the acidic end due to the modification of phosphate groups, so care should be taken when separating proteins to choose a suitable protein separation method and avoid the use of acidic extraction solution and lysis solution.
*11 The fixation effect will be better when replaced with a new fixative after 1h.
*12 Different extraction methods were selected according to the plant materials. tca-acetone method is the most commonly used protein extraction method at present. While the turnip root bark in this paper is rich in polysaccharides and other secondary metabolites, it is more suitable to use phenol method, but the longtime of precipitation has a certain effect on the purity of precipitated protein, so it is beneficial to shorten the precipitation time to improve the purity of protein. Therefore, it should be necessary to know the characteristics of the material under study before extracting plant proteins.
*13 The loading volume is related to the selected gel strip. The Pro-QDiamond staining signal is weak and the recommended loading volume for electrophoresis is the upper limit suggested by the gel strip. Of course, the staining result is also related to the amount of phosphorylated protein in the sample, so the loading volume should be considered comprehensively.
*14 One-way electrophoresis is mainly based on volt-hours, and there are different reference values for voltage setting of different lengths and pH ranges of the gel strips, which can be set by referring to the operation manual.
*15 The purpose of equili/pation is to allow protein molecules to interact sufficiently with SDS to ensure proper migration in the second direction.
*16 Pay attention to the equili/pation time, if it is too short it will affect the efficiency of protein transfer from the IPG strip to the SDS gel; if it is too long it will damage the gel surface and increase the protein loss.
*17 The adhesive strip should be tightly bonded to the adhesive surface to avoid the presence of air bubbles, otherwise it will affect the efficiency of the protein entering the two-way gel in the adhesive strip. Care should be taken to protect the gel surface during the operation of transferring the glue strip into the two-way mold to prevent the glue strip from sticking to the glass wall.
*19 The staining is performed under light-proof conditions, and all subsequent operations should be performed under light-proof conditions. The staining time was controlled within 90 min to prevent non-specific staining.
*20 The results of the study showed that phosphorylated proteins in plant material were mainly distributed at the acidic end, so the glue strip should be selected to cover the acidic end as much as possible to avoid the loss of phosphorylated proteins.
*21 Pay attention to light avoidance.