


X-ray Crystallography
1. Introduction
X-ray crystallography is a technique used for determining the high-resolution, three-dimensional crystal structures of atom and molecules and has been fundamental in the development of many scientific fields. In its first decades of application, it is mainly used for determining the size of atoms, the lengths and types of chemical bonds, the atomic-scale differences among various materials, as well as the crystalline integrity, grain orientation, grain size, film thickness and interface roughness of the related materials, especially minerals and alloys. This method could also reveal the structure and function of many biological molecules like vitamins, drugs, proteins and nucleic acids. Up to date, it is still the chief method for characterizing the atomic structure of new materials and in discerning materials that appear similar by other experiments.
X-ray crystal structures can also explain the unusual electronic or elastic properties of a material, shed light on chemical interactions and processes, or function as the basis for designing pharmaceuticals against diseases. In particular, protein have been extensively put into structure determination by X-ray crystallography, which is also employed routinely in determining how a pharmaceutical drug interacts with its protein target and what changes might improve it. X-ray crystallography method has advantages of no damage to samples, free of pollution, low environmental requirements, high performance and precision over other measuring tools. These advantages make X-ray crystallography the most convenient and important manner to investigate the microstructure of materials.
2. Principle
In a single-crystal X-ray diffraction measurement, a crystal is mounted on a goniometer, which is used to position the crystal at selected orientations. The crystal is illuminated with a finely focused monochromatic beam of X-rays, leading to a diffraction pattern of regularly spaced spots known as reflections. X-ray crystallography works in a manner of elastic scattering with the outgoing X-rays having the same energy and wavelength as the incoming X-rays, which get an altered direction after diffraction. A crystallographer can then produce a three-dimensional picture of the density of electrons within the crystal by measuring the angles and intensities of these diffracted beams under the assistance of the mathematical method Fourier transforms. From this electron density, the mean positions of the atoms, chemical bonds, crystallographic disorder, and some other information in the crystal can be determined. Poor resolution or even errors may occur if the crystals are too small, or not uniform enough in their internal makeup.
3. Workflow
The technique of single crystal X-ray crystallography has three basic steps. The first and usually most difficult step is to produce an adequate crystal of the studied material. The crystal should be sufficiently large with all dimensions larger than 0.1 mm, pure in composition and regular in structure, and have no significant internal imperfections such as cracks or twinning. The crystal is subsequently placed in an intense beam of X-rays, usually of a single wavelength, to produce regular reflection pattern. The angles and intensities of diffracted X-rays are measured with each compound having a unique diffraction pattern. Previous reflections disappear and new ones appear along with the gradual rotation of the crystal, and the intensity of every spot is recorded at every orientation of the crystal. Multiple data sets may have to be collected since each set covers slightly more than half a full rotation of the crystal and typically contains tens of thousands of reflections. Ultimately, these collected data are combined computationally with complementary chemical information to obtain and refine a model from the arrangement of atoms within the crystal. The final refined model of the atomic arrangement is called a crystal structure and usually stored in a public database.
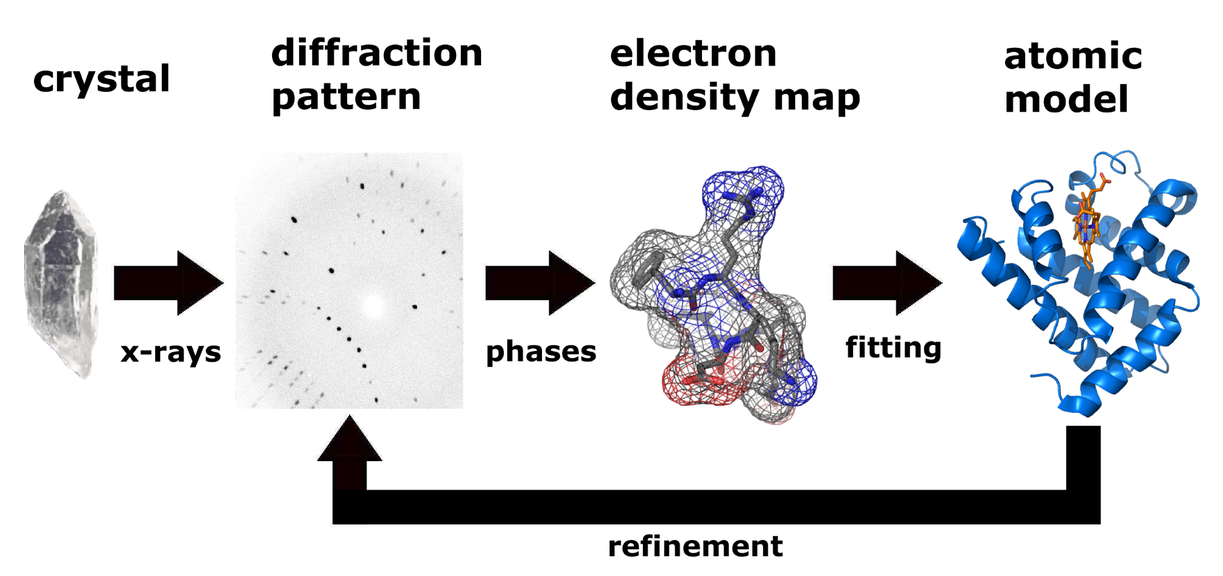 Figure 1. Workflow for solving the molecular structure by X-ray crystallography.
4. Equipments
X-ray sources: rotating anode; synchrotron; free electron laser
5. Procedure
5.1 Crystallization
In most cases, the generation of a diffraction-quality crystal is a primary barrier to solve its atomic-resolution structure. A pure crystal of high regularity is a general requirement in crystallography to solve the structure of a complicated arrangement of atoms. There are many methods to cultivate crystal, such as gas diffusion, liquid phase diffusion, temperature gradient, vacuum sublimation, convection and so on, and the most widely adopted methodology is gas phase diffusion, which can be further divided into hanging drop, sitting drop, oil drop and microdialysis. The crystallography of small molecules and macromolecular differs in the range of possible techniques applied to produce diffraction-quality crystals. Small molecules have few degrees of conformational freedom, and can be crystallized by a wide range of methods. On the contrary, macromolecules have too many degrees of freedom to achieve a perfect crystallization so as to maintain a stable structure.
The range of crystallization conditions is also restricted to solution conditions where biomacromolecules remain folded configuration. There are several factors known to inhibit or ruin crystallization. Crystals generally grow at a constant temperature and are protected from shocks or vibrations that possibly disturb the crystallization. Impurities in the molecules or crystallization solutions are also inimical to crystallization. Molecules with high conformational flexibility or high tendcency to self-assemble into regular helices are often unwilling to assemble into crystals. A slight change in molecular properties can even lead to large differences in crystallization behavior. After acquiring the initial conditions of crystal growth, it is often necessary to optimize the crystallization conditions by adjusting precipitant concentration, pH value, sample concentration, temperature and ionic strength.
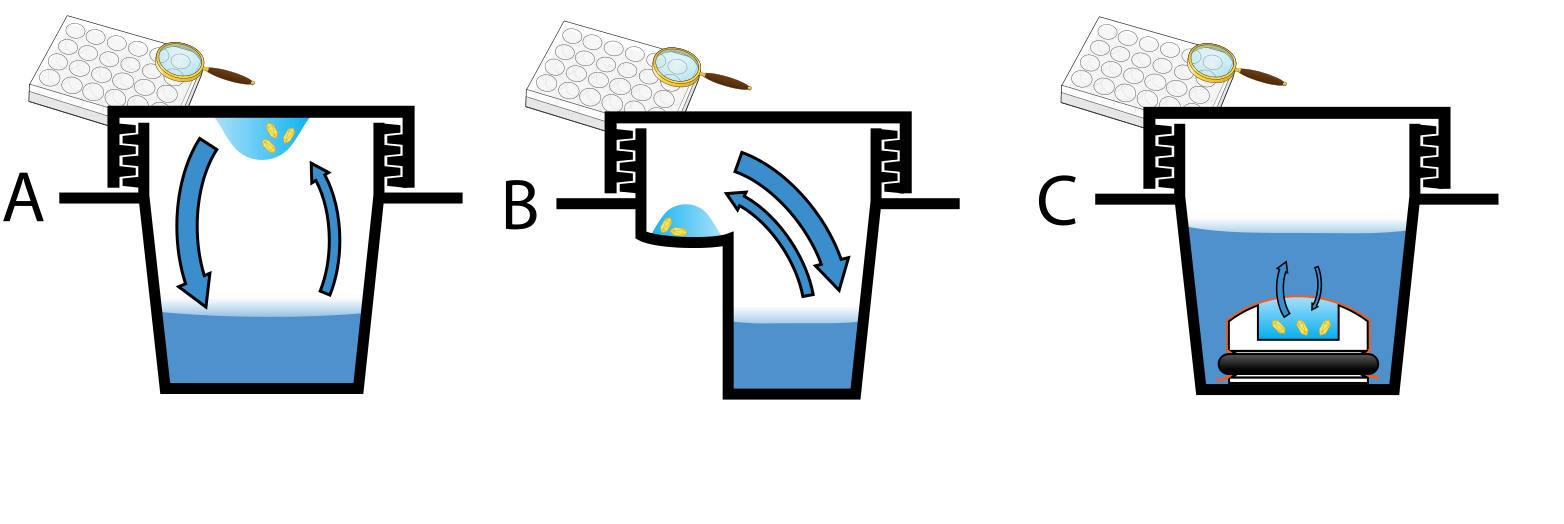 Figure 2.Three methods of preparing crystals: A Hanging drop; B Sitting drop; C Microdialysis.
5.2 Data Collection
Diffraction experiments are needed after obtaining single crystal. The X-ray irradiating to the crystal is diffracted, and the diffraction data are recorded. X-ray has are two main sources, one of which applied in the common X-ray instrument produces X-rays with multiple characteristic wavelengths by bombarding copper targets or molybdenum targets with high energy electron flow. Another one is the X-ray with variable wavelength generated through synchrotron radiation. X-rays from synchrotron radiation can be grouped into angular dispersion synchrotron radiation (ADXD) and energy dispersive synchrotron radiation (EDXRD). The experimental principle of ADXD is the same as that of the normal X-ray diffractometer, while the wavelength is lower and the energy is higher. The incident light of EDXRD is white light with a continuous wavelength, and the diffraction signal is collected at a fixed angle. In comparison with ADXD, EDXRD also has a lower resolution ratio and technical requirement. Diffraction data, including location and intensity of diffraction points, are often recorded by image plates or CCD detectors.
5.3 Data Analysis
The analysis of the recorded diffraction data could indicate the corresponding crystal system and Bravais lattice of crystal, and reveal the miller index and intensity of each diffraction point in the inverted space. Frist of all, indexation, strength integration, consolidation, and amplitude reduction are executed in data analysis procedure. Some problems in the determination of crystallographic parameters are then discussed, which is followed by common data collection and program processing. The intensity data of crystal diffraction finally undergoes a quality assessment.
5.3.1 Crystal Symmetry, Unit Cell, and Image Scaling
Each recorded series of two-dimensional diffraction patterns corresponding to a different crystal orientation, is converted into a three-dimensional model of the electron density, which is completed by the mathematical technique of Fourier transforms. Each spot has a corresponding type of variation in the electron density and which variation corresponds to which spot (indexing) must be determined. The relative strengths of the spots in different images (merging and scaling) and how the variations should be combined to yield the total electron density (phasing) are also necessary to be figured out.
Data processing commences with the reflections indexation, which means identifying the dimensions of the unit cells and which image peak stands for which position in reciprocal space. A byproduct of indexing is to determine the crystal symmetry. The data is then integrated after having assigned symmetry. The hundreds of images containing the thousands of reflections are converted into a single file that consists of records of the miller index of each reflection and intensity for each reflection. These various images taken at different orientations of the crystal are merged and scaled firstly to identify which peaks appear in two or more images (merging) and to scale the relative images so that they have a consistent intensity scale.
The optimization of intensity scale is critical for the peaks intensity since they are the key information from which the structure is determined. The repetitive technique of crystallographic data collection and the high symmetry of crystalline materials lead the diffractometer to repeatedly record many symmetry-equivalent reflections, allowing the calculation of symmetry-related R-factor, which is a reliable index based upon how similar are the measured intensities of symmetry-equivalent reflections, thus evaluating the quality of the data.
5.3.2 Initial Phasing
The data collected from a diffraction experiment represents a reciprocal space of the crystal lattice. The size and shape of the unit cell, and the inherent symmetry within the crystal govern the position of each diffraction 'spot', whose intensity is recorded and proportional to the square of the structure factor amplitude. The structure factor contains information involving both amplitude and phase of a wave, both of which must be known to obtain an interpretable electron density map that enables a crystallographer to build a starting model of the molecule. During a diffraction experiment, the phase cannot be directly recorded, which is known as the phase problem. The estimates of initial phase can be finished in a variety of ways such as Ab initio phasing, direct methods, molecular replacement, anomalous X-ray scattering and heavy atom methods.
5.3.3 Model Building and Phase Refinement
An initial model can be established after obtaining initial phases. This model can be applied to refine the phases, atomic positions and respective Debye-Waller factors with the aim of fitting the observed diffraction data, thus getting an improved model and ideally yielding a better set of phases. A new model can then be fit to a novel electron density map and a further round of refinement is performed, which continuously proceeds until the correlation between the diffraction data and the model is maximized. The agreement is measured by an R-factor defined as
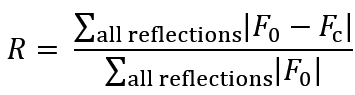
where F is the structural factor. A similar quality criterion Rfree is calculated from a subset of reflections that are not included in the structure refinement. Model qualities including chemical bonding features of stereochemistry, hydrogen bonding and the distribution of bond lengths and angles are complementarily measured. Phase bias is a serious problem in such iterative model building, but can be checked by a common technique of omit maps. In many cases, crystallographic disorder smears the electron density map and weakly scattering atoms are routinely invisible. It is also likely that a single atom appears multiple times in an electron density map. In still other cases, the covalent structure deduced for the molecule is detected to be incorrect or changed.
5.4 Deposition of the Structure
Once the model of a molecular structure is finalized, it would be often deposited in crystallographic databases such as the Cambridge Structural Database for small molecules, the Inorganic Crystal Structure Database for inorganic compounds or the Protein Data Bank for protein structures.
Reference:
1. Stock D, Perisic O, Lowe J. Robotic Nanolitre Protein Crystallisation at the MRC Laboratory of Molecular Biology. Prog Biophys Mol Biol, 2005, 88(3): 311–327.