Cluster of Differentiation
🧪 CD86-55H
Source: HEK293
Species: Human
Tag: Fc&His
Conjugation:
Protein Length: 1-239 aa

🧪 CD84-58H
Source: Human Cells
Species: Human
Tag: His
Conjugation:
Protein Length: 1-225 aa
🧪 CD55-64H
Source: Human Cells
Species: Human
Tag: Fc
Conjugation:
Protein Length: 1-353 aa

🧪 CD80-589H
Source: HEK293
Species: Human
Tag: Fc&His
Conjugation:
Protein Length: 1-242 aa

🧪 CD80-590H
Source: HEK293
Species: Human
Tag: Non
Conjugation:
Protein Length: 1-242 aa


🧪 CD80-591H
Source: HEK293
Species: Human
Tag: His
Conjugation:
Protein Length: 1-242 aa

🧪 CD48-654H
Source: HEK293
Species: Human
Tag: His
Conjugation:
Protein Length: 27-220 aa
🧪 CD5-2222H
Source: HEK293
Species: Human
Tag: His
Conjugation:
Protein Length: 1-372 aa

🧪 CD55-2223H
Source: HEK293
Species: Human
Tag: His
Conjugation:
Protein Length: 35-353 aa

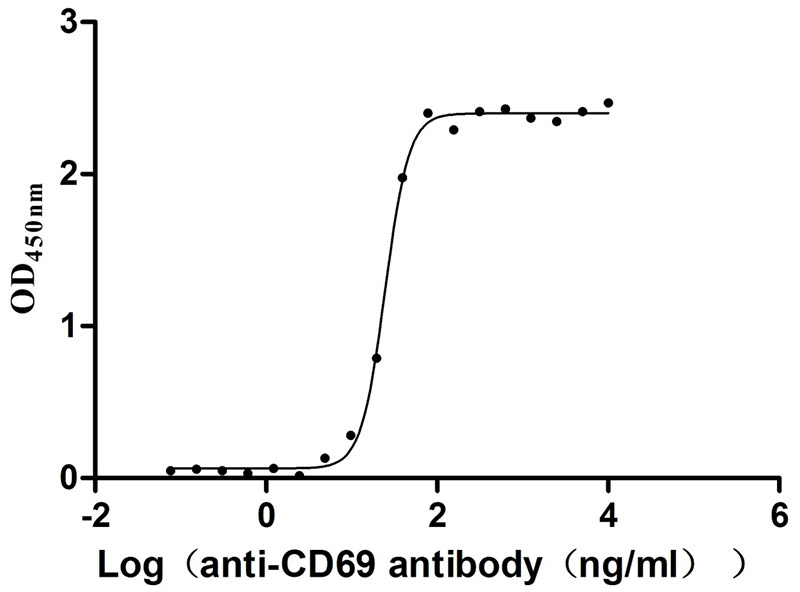
🧪 CD69-2225H
Source: HEK293
Species: Human
Tag: His
Conjugation:
Protein Length: 62-199aa
🧪 CD7-2226H
Source: HEK293
Species: Human
Tag: His
Conjugation:
Protein Length: 26-180 aa

🧪 CD86-2228H
Source: HEK293
Species: Human
Tag: His
Conjugation:
Protein Length: 1-239 aa

🧪 CD97-2229H
Source: HEK293
Species: Human
Tag: His
Conjugation:
Protein Length: 1-398 aa

🧪 Cd7-2280M
Source: HEK293
Species: Mouse
Tag: His
Conjugation:
Protein Length: 1-150 a.a.

🧪 Cd86-2281M
Source: HEK293
Species: Mouse
Tag: His
Conjugation:
Protein Length: Met1-Glu245
Background
What Is Cluster of Differentiation?
Cluster of differentiation (CD) is a surface marker that identifies a particular differentiation lineage recognized by a group of monoclonal antibodies.
CD antigens are molecules originally defined as being present on the cell surface of leucocytes and recognized by specific antibody molecules, but now including some intracellular molecules and molecules present on cells other than leucocytes. Such molecules are assigned a CD number following a consensus reached at regularly held international workshops.

Physiologically, CD antigens do not belong in any particular class of molecules. They can act in numerous ways, often acting as receptors or ligands important to the cell, some CD proteins do not play a role in cell signaling, but have other functions, such as cell adhesion.
Initially, CD designation was intended to describe a cluster of mAbs that display the same cellular reactivity and identify the same molecular species. For instance, CD2 mAbs are reagents that react with a 50-kDa transmembrane glycoprotein expressed on resting T cells. Later, the CD designations were used to describe the recognized molecules, but had to be clarified by attaching the term antigen or molecule to the designation (e.g., CD2 molecule). Currently, CD2 is generally used to designate the molecule, and the CD2 antibody is used to designate the antibody.
Over the past 30 years, the data generated by the 10 Human Leukocyte Differentiation Antigens Workshops have led to the characterization and formal designation of more than 400 molecules. CD molecules are commonly used as cell markers, allowing the identification and isolation of leukocyte populations, subsets, and differentiation stages. mAbs against these molecules have proven to be essential for biomedical research and diagnosis, as well as in biotechnology. More recently, they have been recognized as invaluable tools for the treatment of several malignancies and autoimmune diseases.
CD Nomenclature
The CD nomenclature was proposed and established in the 1st International Workshop and Conference on Human Leukocyte Differentiation Antigens (HLDA). This system was intended for the classification of the many monoclonal antibodies (mAbs) generated by different laboratories around the world against epitopes on the surface molecules of leukocytes (white blood cells). The proposed surface molecule is assigned a CD number once two specific monoclonal antibodies (mAb) are shown to bind to the molecule. A lowercase "w" preceding the number designation stands for "workshop", if the molecule has not been well characterized, or has only one mAb, it is usually given the provisional indicator "w" (as in "CDw186"). A lowercase letter following the CD number (e.g., CD1a, CD1b, CD1c, CD1d, or CD1e) indicates several molecules that share a common chain. Other examples are the integrin chains CD11a, CD11b, and CD11c, all of which share CD18 as a common chain to form different dimers. In other cases, lowercase letters have been used to name different members of the same gene family, as is the case with CD66 (CD66a, CD66b, CD66c, CD66d, CD66e, and CD66f). With regard to carbohydrate CD structures, a lowercase suffix represents a modification of the same carbohydrate sequence (e.g., CD15s = sialylated CD15, Lewisx Ag; CD60b = 9-O-acetylated ganglioside GD3)
The CD nomenclature is also frequently used to describe lymphocyte and leukocyte subsets. The presence or absence of a specific antigen from the surface of the particular cell population is denoted with "+" or "-" respectively. For example, a "CD34+, CD31?" cell is one that expresses CD34, but not CD31. Some cell populations can also be defined as hi, mid or low (alternatively bright, mid or dim), indicating an overall variability in CD expression, particularly when compared to other cells being studied.
The Process of CD Nomenclature
The Human Leucocyte Differentiation Antigens Workshops (HLDA) have since 1984 provided a forum for the characterization and study of leucocyte surface molecules and antibodies against them. The aims are summarized as follows:
• Clarify and bring up to date earlier provisional (CDw) designations.
• Fill in some of the CD numbers that had previously been reserved for members of molecule families such as chemokine receptors.
• Allocate CD numbers to new antibodies and new molecules where adequate data was submitted.
• Initiate multi-laboratory studies on important differentiation markers, irrespective of their cellular location.
The basic workshop protocol was established by the organizing committee, at a meeting in Paris in October 1981. Antibodies accepted for the Workshop were assigned to one of three protocols based on specificity. One group of antibodies was selected because of their specificity for T cells ("T Cell" protocol), one group was selected because of their apparent specificity for B cells and cells from non-T non-B acute leukemias ("B cell plus CALLA" protocol), and one group was selected for reacting primarily with cells of monocytic or granulocytic lineage ("M plus G" protocol).
Each of the three protocols was divided into two levels of study. Level 1 studies were compulsory for all participating laboratories and were designed to assess performance and reliability. A standard set of mAb, including unknown duplicates, were provided for Level 1 work. For Level 2 studies, a separate set of Mab was provided for each of the three protocols. Each participating laboratory received a complete set of antibodies for each protocol performed. A minimum number of tests on specified cell samples was recommended for each protocol.
In order to identify mAb detecting similar antigens, all mAb were compared pair-wise and their similarities or differences designated as the "distance" between them. "Distance" was defined as the mean absolute difference in reactivity between any two mAb pairs tested against cell target cells included in the study. The calculated "distance" for all mAb pairs were then analyzed using a hierarchical clustering algorithm. The algorithm forms clusters beginning with the pairs of mAb showing the closest or "least-distance" associations and then adds successive mAb pairs to the clusters. In this manner, a hierarchical tree was established, linking together in decreasing order of similarity all mAb tested.
Within a given test protocol, once a hierarchical tree was established, cut-points were determined to subdivide the tree into several individual mAb clusters. The level of the cut-points were selected such that the "distances" between mAb within a cluster were minimized while the "distances" between mAb in separate clusters were maximized. In this manner, a family of clusters including all mAb tested was established. These clusters were designated Clusters of Differentiation (CD).
These workshops were instrumental in unraveling the function of leukocyte cell surface molecules and profoundly transformed our understanding of functional properties of immune cells, as well as their differentiation, maturation, and activation. Ten HLDA Workshops have been organized thus far, some protocols have been developed and improved.
The basic strategy was to assess a given mAb’s reactivity with a large panel of different lymphoid cells, followed by statistical analysis of the resulting expression data and further examination of the biochemical nature and molecular mass of the target antigen. Although cellular expression analysis remains essential, modern molecular biology techniques are very useful for a clearer identification of the molecular structures of the target antigens than was possible in the earliest workshops.
Participating laboratories perform specific blind studies with the mAbs included in the panel. This allows for the testing of mAb reactivity with multiple cell types using multiple-color flow cytometry. Other participating researchers perform additional tests, such as immunohistochemistry on tissue sections or the biochemical characterization of the target molecules using immunoprecipitation, Western blots, or binding studies to the recombinant target molecules. The flow cytometry expression data are collected by the organizing laboratory and analyzed using a hierarchical clustering algorithm. The biochemical and molecular biological data are used to further validate the clustering analysis.
What is the Immunophenotyping?
Immunophenotyping is a laboratory method used to identify cells based on the types of antigens or markers present on the surface of the cells. This technique is used in diagnosis and monitoring of diseases such as leukemia and lymphoma. It is also used in research to identify and isolate different cell types.
CD antigens are mostly detected for the identification of populations and subpopulations of immune system cells. A process that uses antibodies to identify cells based on the types of antigens or markers on the surface of the cells. This process is used to diagnose specific types of leukemia lymphoma and other cells of the immune system. Clusters of Differentiation (CD) markers are widely used for immunophenotyping.
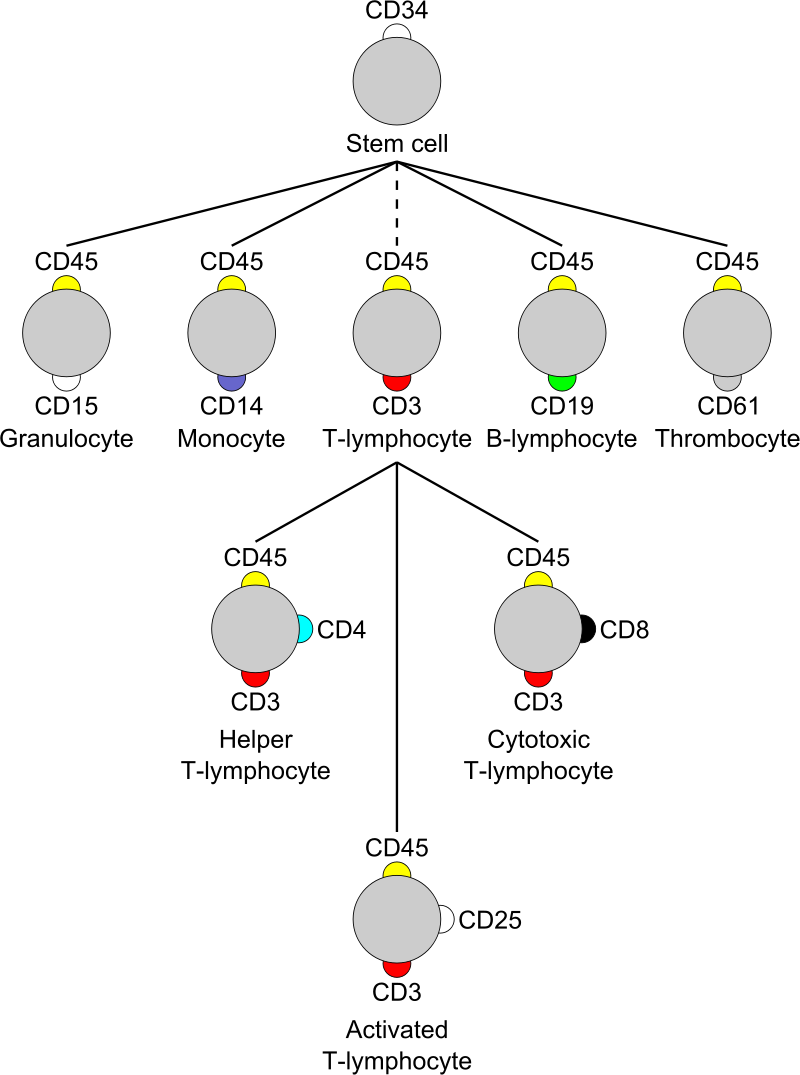
In some cases, CD antigens are expressed only at certain stages of development or under certain conditions. Some of the surface antigens are useful for delineating the cell lineage of leukocytes. Unique assignment of a surface antigen to a particular lineage is best when the antigen is related to a unique functional property of a given cell type. The CD3 surface antigens form part of the T-cell receptor complex for antigens. As such, CD3 is expressed exclusively by mature lymphocytes of the T cell lineage. CD4 and CD8 are, in general, used as markers for the helper and cytotoxic T cells, respectively. These molecules are defined in combination with CD3+, as some other leukocytes also express these CD molecules (some macrophages express low levels of CD4; dendritic cells express high levels of CD8). In addition, CD20 is antigen found exclusively on lymphocytes of the B-cell lineage.
Table1. CD markers for immunophenotyping
| Type of cell | CD markers |
|---|---|
| Stem cells | CD34+, CD31-, CD117 |
| all leukocyte groups | CD45+ |
| Granulocyte | CD45+, CD11b, CD15+, CD24+, CD114+, CD182+ |
| Monocyte | CD4, CD45+, CD14+, CD114+, CD11a, CD11b, CD91+, CD16+ |
| T lymphocyte | CD45+, CD3+ |
| T helper cell | CD45+, CD3+, CD4+ |
| T regulatory cell | CD4, CD25, FOXP3 (a transcription factor) |
| Cytotoxic T cell | CD45+, CD3+, CD8+ |
| B lymphocyte | CD45+, CD19+, CD20+, CD24+, CD38, CD22 |
| Thrombocyte | CD45+, CD61+ |
| Natural killer cell | CD16+, CD56+, CD3-, CD31, CD30, CD38 |
Most CD antigens, however, are expressed at varying levels by many different cell types. Rather than the exclusive expression of a single CD antigen with a particular cell type, it is the peculiar constellation of surface antigens expressed by a given cell that helps assign it to a particular lineage or sublineage of cells. Increasingly, the resolution of many important cell subpopulations requires two or more color multiparameter flow cytometric analyses.
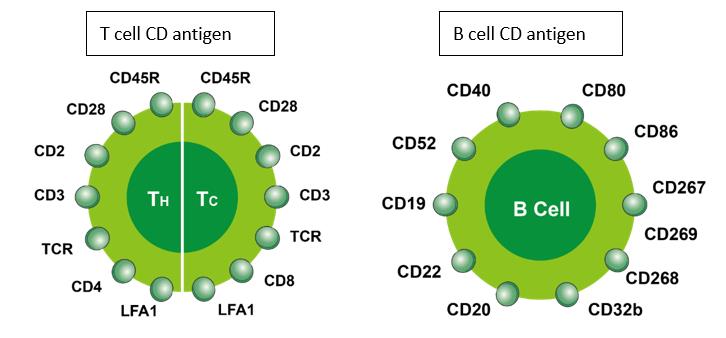
CD3/TCR (T cell receptor complex)
- Tissue distribution
Expressed during thymopoiesis and on mature T cells in the periphery. Less than 10% of human peripheral T cells express the γ/δ TCR complex, but in the mouse, the great majority of T cells present in some epithelial tissues are γ/δ+and have limited receptor diversity. Pre-TCR α (pTCRα) is expressed in immature but not mature T cells.
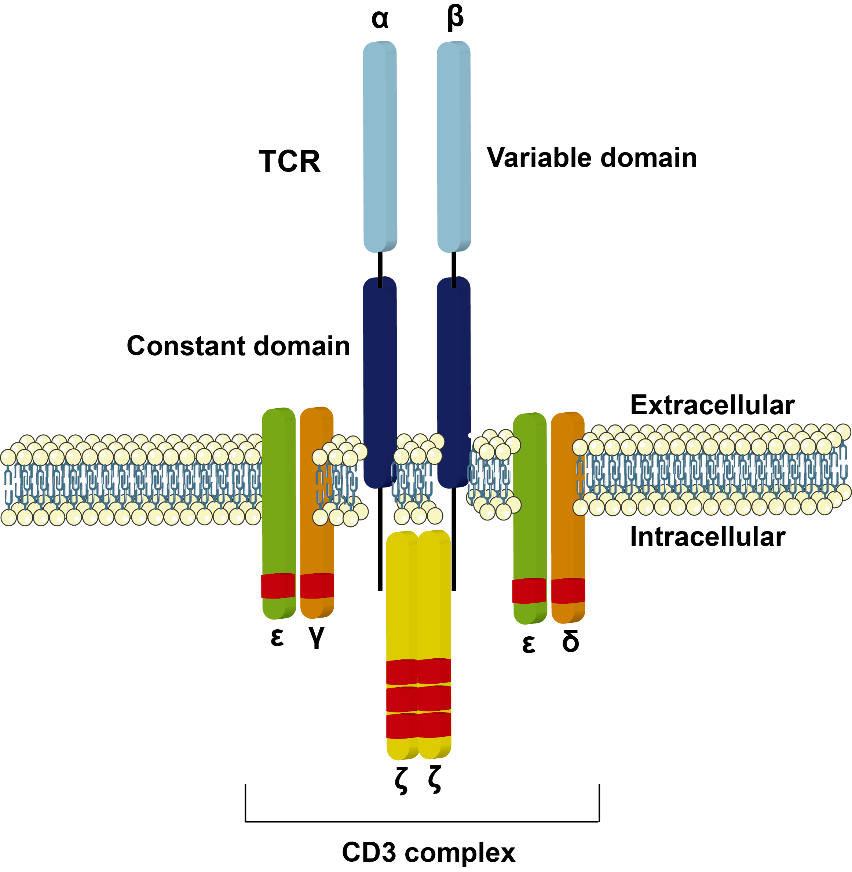
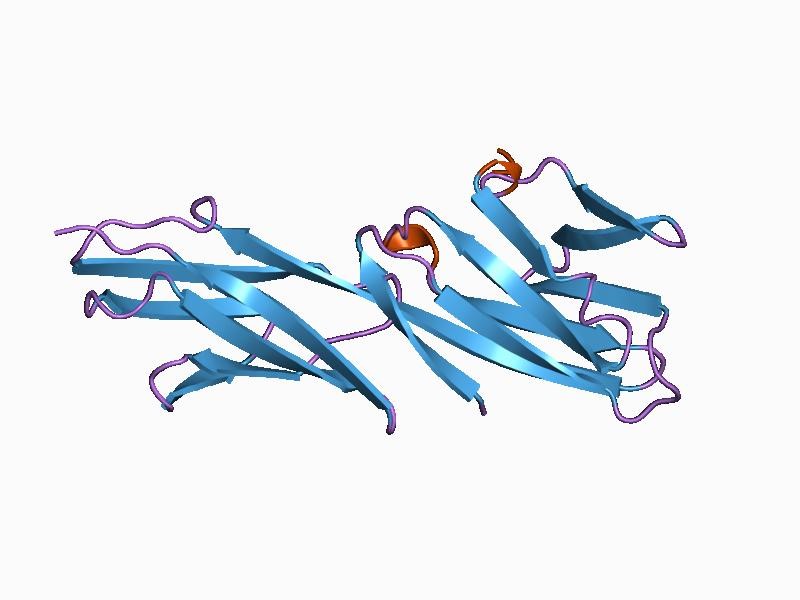
- Structure
CD3/TCR consists of both IgSF and non-IgSF proteins. The stoichiometry of a CD3/TCR complex is not established but is generally thought to contain a TCR hetrodimer, two CD3ε chains, a CD3γ and a CD3δ chain and a ζ homodimer. The α/β andγ/δ heterodimers are clonotypic and consist of Ig-like variable and constant domains. The α/β heterodimer has been crystallized and the structure confirms the predicted IgSF domains. In immature T cells, pTCRα which is comprised of a single conserved IgSF domain in its extracellular region is expressed instead of TCRα. The transmembrane domains of the clonotypic and invariant chains contain oppositely charged amino acids. The ζ chain forms disulfide-linked homodimers or, less frequently, heterodimers with its splicing variant, the η chain. The ζ chain is related to the γ chain of the IgE Fc receptor and can also associate with the Fc receptor CD16. The cytoplasmic domains of the CD3 and ζ chain contain ITAM motifs.
- Ligands and associated molecules
The α/β andγ/δ heterodimers recognize peptide antigen bound to MHC antigens. The affinity of the interaction between the TCR and the MHC/peptide complex is in the range 10-7-10 -4 M. The cocrystal structure of TCR and peptide-MHC reveals that the TCR VDJC junction, which is equivalent to the third complementarity-determining region (CDR3) of antibodies, interacts directly with the peptide and that the CDR1- and CDR2-like regions of the TCR contact peptide and the MHC antigen. Superantigen binds to non-polymorphic regions of TCRVβ. Intracellularly, Fyn is associated with the CD3/TCR complex. Phosphorylated ITAM motifs of the CD3 and ζ chains bind to SH2 domains of intracellular signaling molecules, e.g. phosphorylated ζ chains bind to ZAP- 70.
- Function
Recognition of antigen leads to signal transduction mediated by the invariant chains and subsequently T cell activation. Consequences of binding by TCR depend on antigen density and affinity of TCR for antigen and may result in unresponsiveness. Signal transduction involves tyrosine kinase and phospholipase C activation followed by phosphoinositide turnover and activation of several second messenger pathways.
- Diversity and ontogeny
Although TCR genes contain fewer variable-region segments than antibody genes, the potential repertoire can be argued to be higher than that of antibodies due to the relative abundance of J-region segments and greater flexibility in the joining of variable (V)-, diversity (D)-and joining (J)-segments. Rearrangement of the TCR genes is similar to that of antibody genes and occurs at the CD4-/CD8- stage of thymic development, but the TCR genes do not undergo somatic mutation after rearrangement. Selection of the receptor repertoire takes place in the thymic cortex while the thymocytes coexpress CD4 and CD8 and low levels of the TCR. Mature thymocytes expressing CD4 or CD8 and high levels of the TCR complex then leave the medulla for the periphery. Mice deficient in components of the CD3/TCR complex are arrested in development of their T cell repertoire.
CD4
- Tissue distribution
CD4 is expressed on most thymocytes and approximately two-thirds of peripheral blood T cells, which constitute the CD8- cells. In human and rat but not in mouse, CD4 is expressed on monocytes and macrophages.
- Structure
The extracellular domain is made up of four IgSF domains. The structures of the N-terminal two domains and separately, the membrane-proximal two domains have been determined by X-ray crystallography, confirming that they are Ig-like. Domain 2 is characterized by an unusual disulfide within one βsheet and domain 3 lacks a disulfide in the position conserved in most IgSF domains. Cat CD4 shows some unusual features with 17 residues inserted between domains 1 and 2. There is an additional Cys in domain 1 and the Cys in the unusual β strand C position in domain 2 is replaced with a Trp and there is an extra Cys in the β strand F. The position of the N-terminus has been established for the rat homologue. CD4 shows particularly close similarities in overall structure to the LAG-3 protein. The cytoplasmic domain of CD4 is phosphorylated at Ser residues 408, 415, 431 when T cells are activated by antigen or phorbol esters.
- Ligands and associated molecules
CD4 domains 1 and 2 bind to MHC Class II antigen. There is evidence that CD4 domains 3 and 4 are involved in cis interactions with the CD3/TCR complex. The cytoplasmic domain interacts with a lymphocyte-specific tyrosine kinase called Lck through a CXCP motif. CD4 is a receptor for HIV-1 and the binding of the viral gpl20 protein is to a region of the N-terminal domain.
- Function
CD4 is an accessory molecule in the recognition of foreign antigens in association with MHC Class II antigens by T cells. Interactions with MHC Class II and with Lck have been shown to have a role in CD4 function. MAbs against CD4 inhibit T cell functions in vivo and in vitro.
CD8
- Tissue distribution
CD8 is expressed on most thymocytes and approximately one-third of peripheral blood T cells, which constitute the CD4- cells. CD8αβ heterodimers are expressed only on TCRαβ cells whereas CD8α homodimers can be expressed on αβ and γδ T cells and some NK cells.
- Structure
CD8 is expressed as a heterodimer of CD8α and CD8β or as a CD8α homodimer. CD8α is required for expression of CD8β. The IgSF domains of CD8α and CD8β are separated from transmembrane sequences by hinge regions rich in Pro, Ser and Thr residues containing O-linked carbohydrate, with four sites identified in rat CD8α. The N-terminus of the mature polypeptide has been established by protein sequencing. Alternative splicing gives rise to a soluble form of CD8α and a soluble form is predicted for CD8β. An alternatively spliced form of mouse CD8α, called CD8W, has a shortened cytoplasmic domain. Partial genomic structure of human CD8β shows it has a similar organization to the mouse CD8β gene. The X-ray crystal structure of the IgSF domain of human CD8α did not contain the abnormal disulfide bond found in biochemical analysis of mouse and rat CD8. In the mouse the genes for α and β chains are only 36 kb apart and are closely linked to the Igκ gene locus.
- Ligands and associated molecules
The IgSF domain of CD8α binds to the α3 domain of MHC Class I. Like CD4, a CXCP motif in the cytoplasmic domain of CD8α mediates binding to the tyrosine kinase Lck.
- Function
CD8 acts as a co-receptor with MHC Class I-restricted TCRs in antigen recognition. Analysis of mice lacking CD8α or CD8β shows that the co-receptor function of CD8 is important for selection of MHC Class I-restricted CD8+ T cells during development.
CD Markers in Solid Tumors
Except of defining leukocytes, in some cases, they also have utility in the identification of tumors. Besides, antibodies targeting CD antigens are used clinically in the treatment of tumors and autoimmune diseases and to limit the rejection of transplanted organs. Moreover, the evaluation of the ectopic expression of these markers in solid tumors has led to the detection of disease in early stages.
The expression of some CD markers on tumor cells due to epigenetic changes results in the aggressiveness and resistance of these cells to the therapeutic agents. Hypomethylation of the CpG islands in the promoters of many CD marker genes results in the increased expression of these markers on tumors, which eventually increases tumor survival.
Enhancer of zester homolog 2 (EZH2) has methyltransferase activity, and through the methylation of histone H3, suppresses the expression of tumor suppressor genes and CD markers. There are many miRs suppressing the expression of CD markers on tumor cells, which in fact play the role of tumor suppressors by binding the 3’-untranslated region (3’-UTR) of CD marker mRNAs and prevent their expression. However, in methylated tumor cells, binding of inhibitory factors to the promoter regions of these miRs reduces their expression and in turn increase the expression of CD markers. Therefore, the CD markers expressed on tumor cells could be used as diagnostic and prognostic factors and might also detect the signaling pathways inactivating the tumor suppressors.
Table2. Effect of epigenetic changes on the expression of CD markers
| miRNA | Expression | Disease | CD marker | Mechanisms | Prognosis |
|---|---|---|---|---|---|
| miR-199-5b | Down |
Medullobla stoma |
CD15 |
Methylation in the CpG islands at the upstream promoter |
Poor |
| miR-199a | Down |
Ovarian cancer |
CD44 | Binding site in the 3'-UTR | Poor |
| miR-193a | Down |
Ovarian cancer |
CD117 |
Binding of E2F6 to polycombcomplex of miR-193a |
Poor |
| miR-370 | Down |
Lung cancer |
CD105 |
Binding TRAF4 in the 3'-UTR of miR-370 |
Poor |
| miR-142-3p | Down |
Hepatic and colon cancer |
CD133 |
Binding OCT4 to promoter of miR-142-3p |
Poor |
| miR-34a | Down |
Prostate cancer |
CD44 |
BExpression of miR-34a is repressed by p53 |
Poor |
|
miR-224 |
Down |
pancreatic ductal adenocarcin omas |
CD40 |
Binding site in tpa 3'-UTR of CD40 |
Poor |
| miR-200 | Down |
Lung cancer |
CD274 |
Binding site in the 3'-UTR of CD274 |
Poor |
Table3. The expression of CD makers in cancers and their diagnostic and prognostic value
| Type of Cancer | Commonly indentified CD markers | Prognostic CD markers | Diagnostic CD markers | Type of sample | Type of diagostic technique |
|---|---|---|---|---|---|
|
Liver |
CD133, CD44, CD90, CD105, CD34, CD151, CD206, CD68 |
CD151, CD68, CD206 |
------ |
Tissue, Cell line |
IHC, Flow cytometery, RT-PCR |
|
Colerctal |
CD66, CD110, CD133, CD44, CD2, CD89, CD200 |
CD110, CD133, CD44, CD200 |
CD66 |
Tissue, Cell line, Peripheral blood |
IHC, Flow cytometery, RT-PCR |
|
Lung |
CD117, CD176, CD166, CD88, CD103CD66 |
CD88, CD103, |
CD66 |
Tissue, Cell line, Peripheral blood |
IHC, Flow cytometery, RT-PCR |
|
Breast |
CD44, CD24, CD133, CD14, CD200, CD4 CD8, CD4 CD25 |
CD44, CD133, CD14 |
------ |
Tissue, Cell line, Peripheral blood |
IHC, Flow cytometery, ELISA |
Table4. Expression of CD makers and their response to treatment
| Cancer | predictive CD markers | Function | Type of treatment | Response |
|---|---|---|---|---|
|
Liver |
CD133 | Activation of ERK pathway | Sorafenib | Ineffective |
| CD279 | Phosphorylation of ERK | Sorafenib +anti-PD-1 |
Good | |
| CD152 | Suppression of T-cells | Tremelimumab+TACE | Good | |
|
Colorectal |
CD66 | Apoptosis | Chemotherapy-5-FU | Good |
| CD47 | Mediated phagocytosis by macrophage | mAb | Good | |
| CD147 | Apoptosis and arrested cell cycle | 5-FU | Good | |
|
Lung |
CD133 | Expression ABCG2 and CXCR4 | Cisplatin | Ineffective |
| CD317 | Induced ADCC and CDC | mAb | Good | |
| CD66 | Sensitive to anoikis | 8F5m Ab+Paclitaxel | Good | |
|
Breast |
CD166 | ----- | Taxane-free adjuvant chemotherapy |
Good |
| HER2 with CD3 | Stimulate T-cell | Specific Ab | Good | |
| CD24 | Reduce expression drug resistance factor |
Chemotherapy-5-FU | Good |
Case Study
Case 1: Onkanga IO, Hamilton R, Mwinzi PNM, et al. Expression of CD117 (c-Kit) on Circulating B Cells in Pediatric Schistosomiasis. Infect Immun. 2022 Aug 18;90(8):e0016022. doi: 10.1128/iai.00160-22. Epub 2022 Jul 6. PMID: 35862720; PMCID: PMC9387214.
Few B cells express CD27, the primary marker for memory B cells, in pediatric schistosomiasis, suggesting B cell malfunction. This study further demonstrates unexpected high expression of CD117 on circulating B cells in children highly exposed to Schistosoma mansoni infectious larvae.
The researchers found that CD117-positive (CD117+) B cells increased with the intensity of schistosome infection. In addition, CD117 expression was reduced on CD23+ B cells previously shown to correlate with resistance to infection. Stimulation with a panel of cytokines demonstrated that CD117 levels were upregulated in response to a combination of interleukin 4 (IL-4) and stem cell factor (SCF), the ligand for CD117, whereas IL-2 led to a reduction.
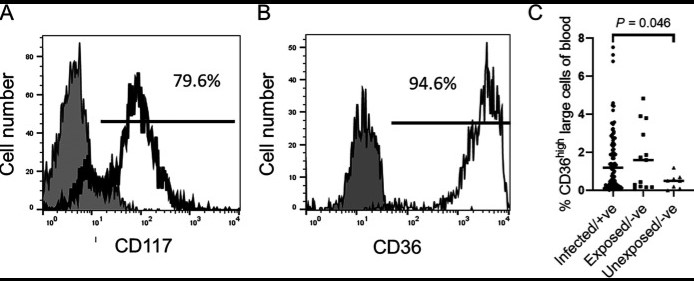
Fig1. Accumulation of reticulocyte-like cells in the blood of children. (A and B) Expression of CD117 and CD36, known to be expressed by reticulocytes, in the large cell population as shown in (Fig. 1A). Gray fill, isotype control; black line, anti-CD117 (A) or anti-CD36 (B). (C) Mean percentages of CD36high large cells in children infected with S. mansoni (n = 93), exposed children with undetected infection (n = 13), and children uninfected and unexposed (n = 8).
Case 2: Li B, McCrudden CM, Yuen HF, et al. CD133 in brain tumor: the prognostic factor. Oncotarget. 2017 Feb 14;8(7):11144-11159. doi: 10.18632/oncotarget.14406. PMID: 28055976; PMCID: PMC5355253.
CD133 has been shown to be an important stem cell factor that promotes glioma progression. However, the mechanism for CD133-mediated glioma progression has yet to be fully elucidated. In this study, we found that CD133 mRNA expression was a prognostic marker in three independent glioma patient cohorts, corroborating a putative role for CD133 in glioma progression. Importantly, we found that CD133 expression in glioma was highly correlated with the expression of HOX gene stem cell factors (HOXA5, HOXA7, HOXA10, HOXC4 and HOXC6). The expression of these HOX genes individually was significantly associated with survival.
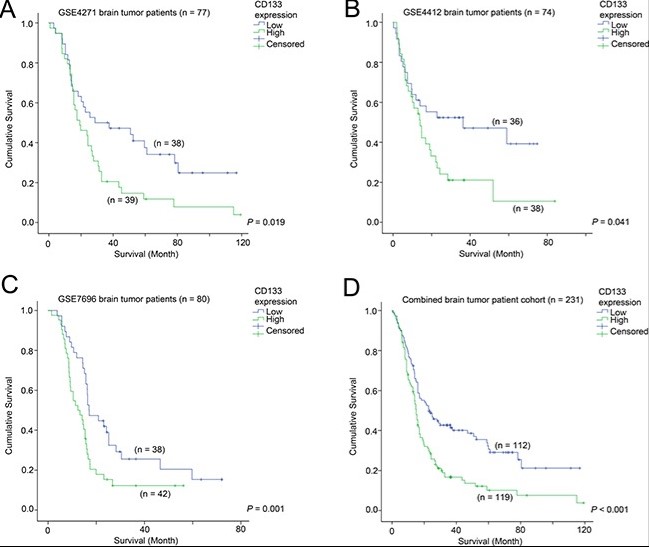
Fig2. The association between CD133 and patient survival Kaplan-Meier analyses for CD133 mRNA expression in (A) GSE4271, (B) GSE4412, (C) GSE7696, and (D) the combined cohort.
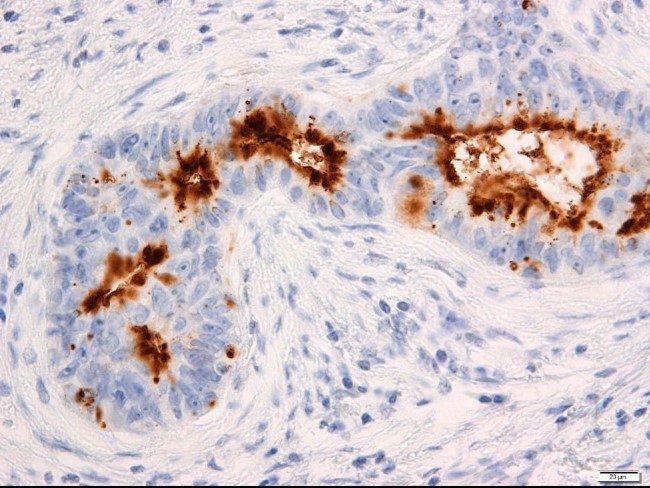
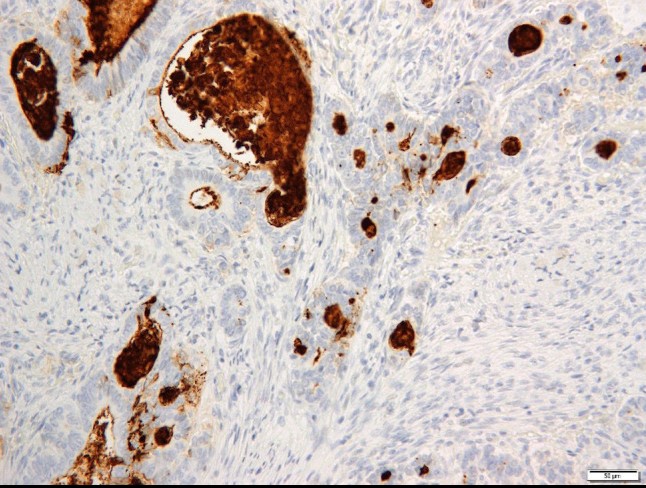
Case 3: Oi H, Okuyama T, Miyazaki S, Ono Y, Oya M. CD133 Expression Predicts Relapse in Patients With Locally Advanced Rectal Cancer Treated With Neoadjuvant Chemotherapy. In Vivo. 2021 Jan-Feb;35(1):437-445. doi: 10.21873/invivo.12276. PMID: 33402494; PMCID: PMC7880757.
The aim of the present study was to explore the association between CD133 expression and postoperative relapses in patients with locally advanced rectal cancer (LARC) who received neoadjuvant chemotherapy (NAC). High CD133 expression was observed in 22 patients (42.3%). Patients with high CD133 expression had more frequent vessel invasion and relapse than those with low CD133 expression. CD133 expression may be a predictive biomarker for postoperative relapse in patients with LARC who received NAC before surgery.
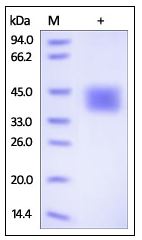
3ug by SDS-PAGE under reducing condition and visualized by coomassie blue stain. The purity of the protein is greater than 95%. (CTLA4-01H)
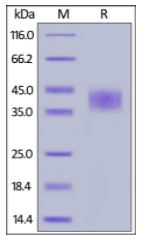
Human GITR Ligand, Fc Tag on SDS-PAGE under reducing (R) condition. The gel was stained overnight with Coomassie Blue. The purity of the protein is greater than 95%. (TNFSF18-37H)