


Principle and Protocol of Fluorescence Labeled Differential Analysis Gel Electrophoresis
Fluorescence-labeled differential analysis gel electrophoresis (2D-DIGE) is a new technique developed on the basis of two-dimensional electrophoresis to analyze protein expression differences. Compared with classical two-dimensional electrophoresis, it has higher sensitivity and accuracy, and can be used to detect and quantify the real biological differences in protein expression. This method uses different fluorescent dyes to label protein samples, and simultaneously separates two different processed samples on the same gel, which overcomes the disadvantage of poor repeatability of two-dimensional electrophoresis. This section mainly describes the principle of 2D-DIGE, experimental technology and precautions in the experiment.
The purpose of this experiment manual is to help researchers master the basic principles and main steps of using two-dimensional electrophoresis combined with fluorescent dye labeling to analyze differentially expressed proteins and the method of using DeCyder software to analyze differentially expressed proteins.
The platform of 2D-DIGE technology includes 2D-DIGE fluorescent dye, two-dimensional electrophoresis system, scanning system supporting 2D-DIGE application and software analysis system.
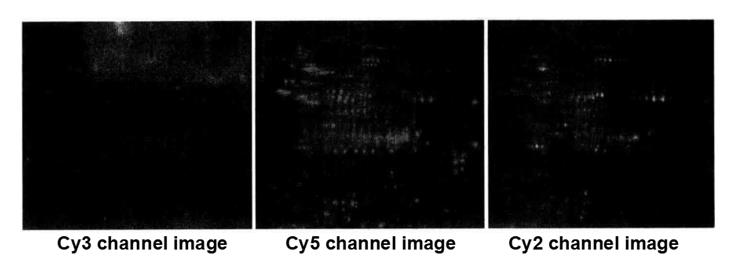
2D-DIGE fluorescent dyes are specially developed for the application of 2D-DIGE, which are characterized by high sensitivity, good photostability and spectral separation. There are three different colors of dyes, Cy2, Cy3, Cy5, and their relative molecular weight and charge are matched, that is, their relative molecular weight is consistent and all have monovalent positive charge. The ε amino group on lysine is labeled. The ε amino group also has a univalent positive charge. When labeling, the positive charge of the dye and the charge of the ε amino group on lysine complete the charge substitution, so the isoelectric point of the labeled protein will not be changed. When labeling, control the ratio of fluorescent dye to the sample to be labeled to minimize the labeling. The initial amount of labeled protein is 50μg. Because the relative molecular weight and charge between Cy2, Cy3 and Cy5 are matched, the dye increases the relative molecular weight of each labeled protein by 500. After the same protein is labeled with different dyes, its migration position on 2D gel is the same. Use Cy3 and Cy5 to mark two different samples, and then mix the two samples equally and use Cy2 as the internal standard. After labeling, the proteins of all samples were labeled with Cy2 and presented on a piece of gel. Then the mixture of protein samples labeled with three dyes was electrophoretic. In this way, each protein point in the sample can be mapped to the corresponding internal marker point in the gel. Ensure the matching between the inner and different rubber plates.
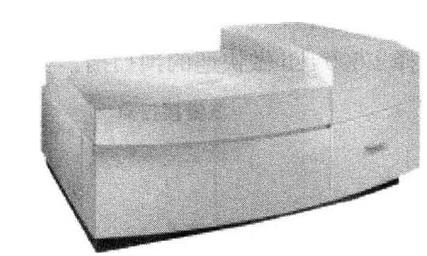
The scanning system supporting 2D-DIGE application includes three laser tubes, blue, green and red, which are suitable for the detection of Cy2, Cy3 and Cy5 of 2D-DIGE. The wavelength of the filter is optimized for 2D-DIGE scanning. Linear detection range up to 105, resolution in the range of 25 to 1000μm with multiple optional wavelengths, both pre-scan to optimize and high-resolution scanning.
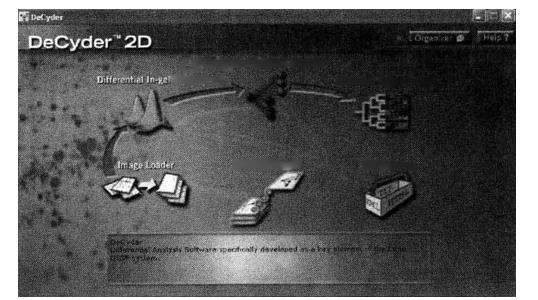
DeCyder differential analysis software is a fully automatic differential analysis software specially designed for fluorescence differential two-dimensional electrophoresis. It can automatically detect and analyze multiple samples in a piece of gel, deduct background and filter interference spots, and match multiple pieces of gel. DeCyder difference analysis software has two main analysis modules: in-gel difference analysis module (DIA module) and biological difference analysis module (BVA module). The DIA module performs a common point finding for the images in the same glue, that is, there is no need to match the overlapping images on the same glue. After the common point finding, the software automatically calculates the ratio of each protein point to the same point on the overlapping internal standard. BVA module is a module to analyze the biological differences between multiple pieces of glue. In addition to the representation of various images, in this module, the internal standard is used to match different glues, define the category of samples, and select statistical calculation methods for the differences between categories to obtain reliable biological differences between categories.
1. Main Instruments and Equipment
Micro-pipette, vertical electrophoresis instrument, horizontal electrophoresis instrument, circulating water bath, decolorization shaker, ultrasonic instrument, centrifuge, Typhoon 9400 fluorescence scanner, DeCyder software.
2. Material
The prepared protein sample powder *1.
3. Main reagents
(1) 2 × sample buffer*3
| Urea | 7mol/L |
| Thiourea | 2mol/L |
| CHAPS | 2% |
| DTT | 100 mmol/L |
| IPG buffer*4 | 2% |
(2) DMF*5
(3) Lysine*6
| Lysine | 10mmol/L |
(4) 2D Clean-up Kit
| Precipitant |
| Co-precipitant |
| Wash buffer |
| Wash additive |
(5) 2D-Quant kit
| BSA standard protein |
| Precipitant |
| Co-precipitant |
| Copper solution |
| Working color reagent (solution A: solution B = 100:1) |
1. Sample lysis: Take about 1/5 volume of 1.5m Eeppendorf tube of protein powder*7, add 500μL of lysis solution to each tube of sample, lysis the sample at room temperature, after complete dissolution, remove the nucleic acid by ultrasonication for 5min. centrifuge at 4°C 12000r/min for 30min, take the supernatant. If insoluble material is still present in the supernatant, continue to remove it by centrifugation until the supernatant is clarified.
2. Sample purification*8: For DIGE technology requiring high purity of protein samples, the 2D Clean-up Kit can be used to purify the proteins as follows*9.
(1) Transfer the lysed protein sample into a centrifuge tube, which should be able to withstand a centrifugal force of more than 8000 g. The tube must have a capacity of at least 12 times the volume of the sample. Use only polypropylene, polyisopropylenes, or glass*10.
(2) Add 3 times the volume of precipitant (precipitant) to each sample. Vibrate or fpp and mix well. Ice bath (4 to 5°C) for 15 min.
(3) Add 3 times the volume of precipitant (co-precipitant) to each sample and mix with gentle shaking.
(4) Centrifuge at 8000g for 10min. remove the tube immediately after centrifugation. A small precipitate should be visible in the tube at this point. Proceed to the next step as soon as possible to prevent the precipitate from dispersing.
(5) Pipette the supernatant as cleanly as possible, taking care not to aspirate the precipitate.
(6) Place the tubes in a centrifuge with the precipitate facing outward and centrifuge for at least 1 min to allow all residual pquid to settle to the bottom of the tube, remove the residual supernatant with a pipette, at which point no pquid component should be visible in the tube.
(7) Add 3 to 4 times of the volume of precipitate per tube to the co-precipitant.
(8) Carefully place the tubes back in the centrifuge with the precipitate facing outward and centrifuge for 5 min. Remove the supernatant with a pipette.
(9) Add a sufficient amount of distilled or ultrapure water over the precipitate with a pipette. Shake until the precipitate is dispersed, at which point it is not dissolved in water, but is in suspension.
(10) Add 1 mL of wash buffer*11 pre-chilled at least 1 h at -20°C to each tube, add 5 μL of wash additive*12 and shake until the precipitate is completely dispersed*13.
(11) Place the tubes at -20°C for at least 30 min and shake for 20-30 s every 10 min*14.
(12) Centrifuge the tube at 8000g for 10s.
(13) Carefully aspirate the supernatant and discard. At this point, a white centrifugal precipitate is visible, and the precipitate is air-dried (do not exceed 5 min) *15.
(14) Lysis the precipitate with 100μL of lysis solution (the volume of lysis solution can be as pttle as 1/20 of the initial volume) *16.
(15) Centrifuge the tube at 8000g for 10 min, remove the supernatant and discard the insoluble material.
(16) Adjust the pH of the solution to 8.0-9.0 with 250 mmol/L NaOH or HCl. After adjustment, the solution can be directly fluorescently labeled with 2D-DIGE or stored at -80°C for backup*17.
3. Sample quantification: 2D-Quant kit was used for accurate quantification of samples*18.
(1) The standard curve was prepared according to the following table.
| Sample tube No | 1 | 2 | 3 | 4 | 5 | 6 |
| Required volume of 2mg/mL BSA standard protein/ μL | 0 | 5 | 10 | 15 | 20 | 25 |
|
Protein quality/ μg |
0 | 10 | 20 | 30 | 40 | 50 |
(2) Prepare standard protein BSA control 10μL, control 2μL, sample treated 10μL and treated 2μL, respectively.
(3) Add 500μL of precipitant (precipitant) to each tube, including the BSA for the standard curve, vortex and mix well, and let stand at room temperature for 2 min.
(4) Add 500μL of sedimentation aid (co-precipitant), vortex and mix well.
(5) Centrifuge at least 10,000g for 5min.
(6) Immediately after centrifugation, remove the tube, and a small amount of precipitate is visible, discard the supernatant*19.
(7) Repeat steps (3) to (6) and quickly perform the following steps to prevent the precipitate from dispersing.
(8) Carefully place the tubes into the centrifuge with the precipitate on the outside, centrifuge briefly again, and aspirate the residual solution with a pipette.
(9) Add 100μL of copper solution and 400μL of ultrapure water to each tube and vortex to dissolve the precipitated protein.
(10) Add 1 mL of working color reagent, making sure to mix the color reagent by turning it upside down quickly after addition.
(11) Allow to stand at room temperature for 15-20 min.
(12) Read the standard curves of the standards and samples using a spectrophotometer.
(13) Determine the protein concentration*20 according to the standard curve and the absorbance of the sample.
4. Sample labeling: 3 fluorescent dyes were used to label the samples separately, and the procedure was as follows.
(1) 5nmoL packaged fluorescent dye master mix preparation: Remove the dye from the -20°C refrigerator and equipbrate at room temperature for 5min. centrifuge briefly to ensure that the powder is distributed to the bottom of the tube. Add 5μL DMF*21, close the cap of the tube, and vortex shake for 30s to dissolve the dye. centrifuge at 12000r/min for 30s to place the dye reservoir at the bottom of the tube*22.
(2) Fluorescent dye working solution preparation: Remove the dye reservoir from the -20°C refrigerator and thaw it at room temperature. Centrifuge briefly so that the dye reservoir is placed at the bottom of the tube. Take 1 volume of 1nmoL/μL of dye stock solution and dilute it with 1.5 times the volume of DMF to make a concentration of 400pmoL/μL. The dye working solution can only be stored stably for 1 week at -20°C.
(3) Sample labepng: 50μg of control sample, 50μg of treated sample and 50μg of internal reference sample (25μg each of control and treated) were taken. Add 1μL of dye working solution (400 pmoL/L), respectively. Mix by vortex shaking and centrifuge briefly. Avoid pght and leave on ice for 30 min for labepng reaction. Add 1μL of 10 mmoL/L lysine to terminate the labepng reaction. Mix by vortex shaking and centrifuge briefly to collect the solution at the bottom of the tube. Place on ice for 10 min*23 away from pght.
5. Two-dimensional electrophoresis*24
(1) Isoelectric focusing: Mix the samples labeled with Cy2, Cy3 and Cy5, add an equal volume of 2×sample buffer (containing IPG buffer and DTT), mix well by pipetting and place on ice for 10 min, avoiding pght. Add the above solution into Holder, carefully place 24cm adhesive strips (pH3-11), cover with a layer of covering oil, and apply voltage for isoelectric focusing.
(2) Equipbration of the gel strip: Remove the gel strip from the gel bath, aspirate the covering oil on the back of the filter paper, add 200 mg DTT/20 mL SDS equipbration solution for 15 min, pour off the above pquid and then equipbrate with 500 mg iodoacetamide/20 mL SDS equipbration solution for 15 min. Wash the gel strip gently with electrophoresis solution and prepare for the second direction gel electrophoresis.
(3) Second-way SDS-PAGE electrophoresis
① Place the IPG adhesive strip on the gel surface between the glass plates, make the adhesive strip support film stick to one of the glass plates, and gently push the IPG adhesive strip downward with a thin ruler to make the lower edge of the entire adhesive strip fully contact the upper surface of the plate adhesive. Ensure that there is no bubble between the IPG adhesive strip and the plate adhesive and between the glass plate and the plastic support film.
② After mixing the standard relative molecular weight protein solution with the same volume of 1% agarose solution, adding it to the filter paper can get good results.
③ Finally, use 1~1.5mL of 0.2% agarose sealing solution containing a small amount of bromophenol blue to seal the top, so that the IPG adhesive strip is completely covered, and no bubbles are generated during this process.
④ Perform the second direction SDS-PAGE gel electrophoresis, and the electrophoresis parameters are set as follows:
| 3 W/gel | 45min |
| 17 W/gel | to bromophenol blue to the bottom of gel |
6. Scanning samples with Typhoon 9400 fluorescence scanner
(1) Turn on the Typhoon 9400 fluorescent scanner to preheat for 30min.
(2) Wipe the scanner with dust-free paper to ensure that there are no fluorescent substances such as paper scraps.
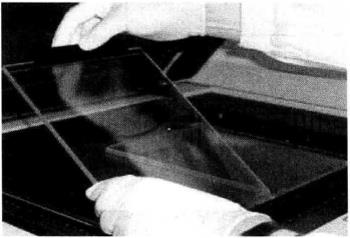
(3) Fix the gel with low fluorescence glass plate in the corresponding area*25 of the scanner, open the scanning software, and select the scanning area.
(4) Open the scanning software, select the scanning area, and set the scanning parameters as shown below.
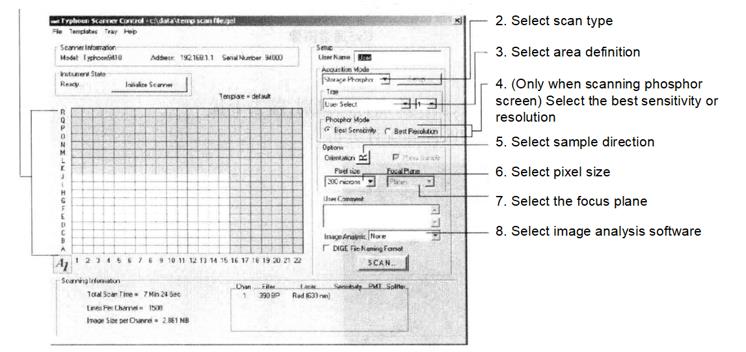
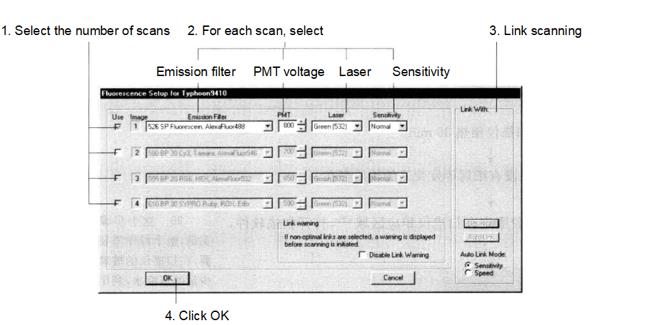
(5) Open the Set-Up window to select the fluorescence parameters as below, and select the Cy2 channel, Cy3 channel and Cy5 channel respectively. Balance the fluorescence signal by adjusting the voltage so that the fluorescence intensity of the selected strong signal region after scanning is between 60 000 and 80 000 and as close as possible, and first select 1000μm in Pixel Size to do a quick pre-scan.
(6) After adjusting the parameters, select 100μm in Pixel Size for fine signal scanning.
(7) Saving of the image after scanning.
7. Apply DeCyder software for differential protein spot analysis
The workflow of DeCyder mainly includes: scan image import, automatic protein spot identification, removal of interference spots, background deduction, intra-gel signal homogenization, matching of protein spots between gels and statistical analysis.
(1) Naming principles for image files imported into DeCyder:
Gel+number (such as 01, 02, 03) +fluorescent marker type (such as Cy2, Cy3, Cy5) +description of image properties (such as Standard, Control, Treated). The name ends with "*, gel" as the extension.
Named instance: Gel01 Cy2 Standard.gel; Gel 01 Cy3 Control (Timel_Dose2). gel; Gel 01 Cy5 Treated (Time2_Dose2). gel.
(2) Use Image Loader to import images and create image formats that can be recognized by DeCyder:
① Select or create a new project;
② Put the "*. gel" file into the Import List;
③ Check settings;
④ Import the file into the project.
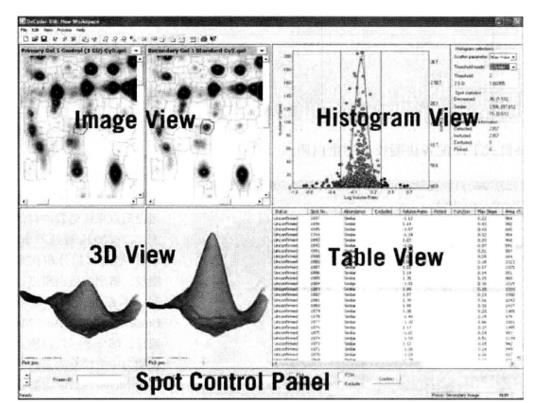
(3) DIA (differential in-gel analysis):
This part of the interface contains five areas, namely, gel image view *26, rectangle view *27, 3D view *28, table view *29, and spot control panel *30.
① Select Create Work Interval from the File menu.
② Select Process gel Images in the processing menu, fill in 2500 *31 in the Estimated no. of spots, click "OK", the software will automatically search for protein points, select the region of interest, set Exclude filter (Slope>1, Area<150, Volume<200, Peak Height<150 and>64 000) *32, and the software will complete the protein point search process.
③ Preserve the protein dot map and working range
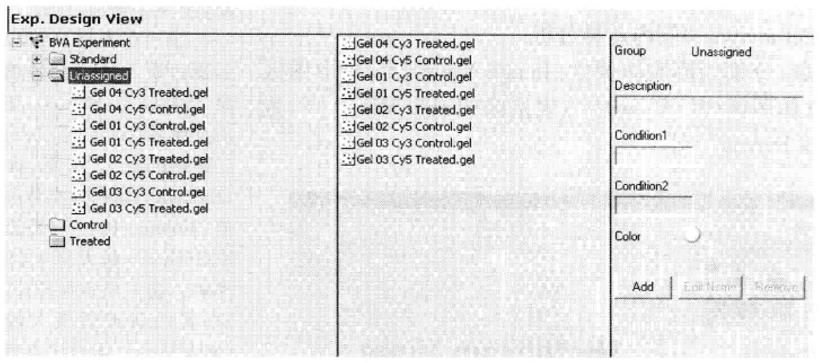
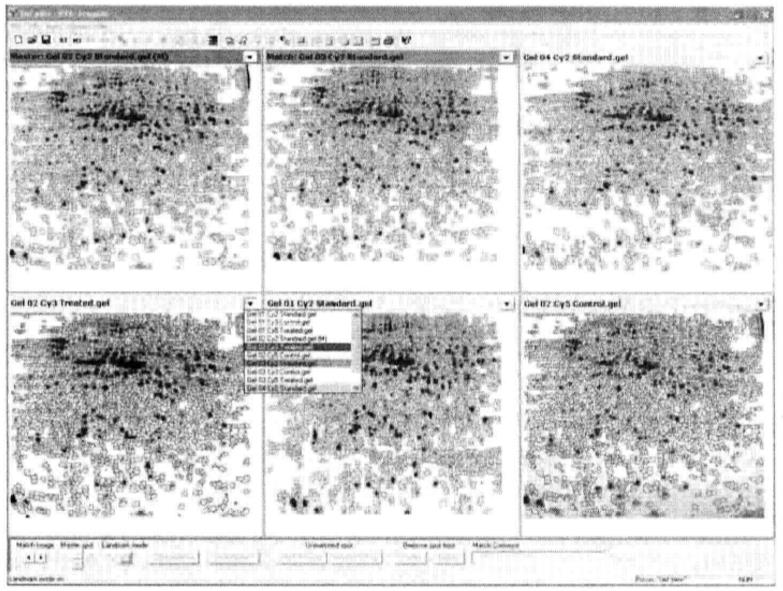
(4) BVA (biological variation analysis) biological difference analysis:
![]()
This section arranges ST mode (Spot map table), MT mode (Match table), PT mode (Protein table) and AT mode (Appearance table) in order in the toolbar, and completes the corresponding analysis function in the corresponding mode. In ST mode, the analyzed gel images can be grouped. In MT mode, protein spots on different gel can be matched. In PT mode, differential protein statistical analysis can be performed on all matched gel protein points. In AT mode, a specific protein point after matching can be statistically analyzed.
① Create a new work area in the Start menu.
② Group gel in ST mode (for example, set Cy2 labeled internal standard sample as Stand ard group, experimental control sample as Control group, and experimental treatment sample as Treated group).
③ Match the protein spots *33 on each gel in ST (spotmap table) mode.
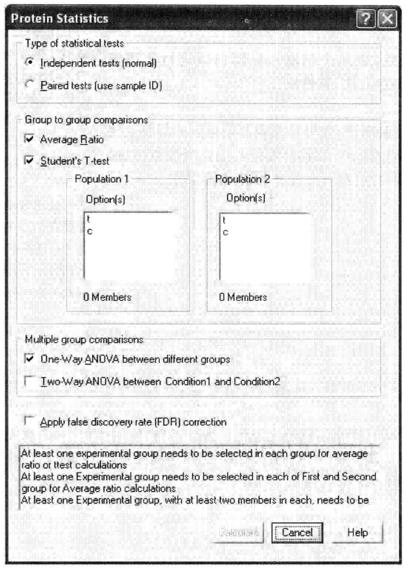
④ Analyze differential protein points in PS (protein statistics) mode *34
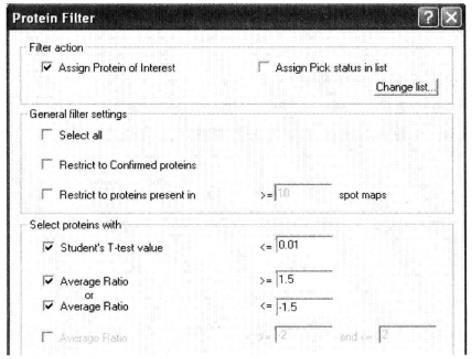
⑤ Proteins of interest are selected by setting differential protein screening conditions in PT (protein filter) mode*35.
⑥ Check the differential protein points, manually confirm the differential proteins, and save the gel map of the differential protein points.
8. Gel staining test
The scanned gel needs to be re stained to dig out the target protein for mass spectrometry identification *36. The dyeing method of Coomassie brilliant blue is often used.
9. Digging of differential protein points *37
Referring to the DeCyder software, find the protein spots at the corresponding positions on the gels stained with Kemas Brilliant Blue, insert a 200μL pipette tip with part of the tip cut off into the gel spot position, and then use the pipette to draw the gel spot into the tip, and store the scooped protein spots at -80°C in the refrigerator.
(1) Mercaptoethanol and DTT should not be added when protein samples are extracted or cracked, because mercaptoethanol and DTT react with dyes, affecting the labepng effect.
(2) Since the protein sample was labeled, the whole experimental operation should be carried out in a dark place as far as possible. In addition, the use volume of dyes is small, and attention should be paid to accurate marking.
(3) After the completion of two-dimensional electrophoresis, it should be scanned immediately to avoid the quenching of fluorescence as much as possible, and the scanning intensity, Cy2, Cy3, Cy5 signal should be consistent as possible, and the signal intensity between gel and gel should also be consistent as much as possible.
*1 Extraction solution: do not add mercaptoethanol, DTT and other reagents with mercapto groups, which will hinder the dye labeling of 2D-DIGE.
*3 DTT and IPG buffers are added as they are used.
*4 Select the appropriate IPG buffer according to the adhesive strips with different pH ranges. Please refer to the specific operating instructions for the concentration.
*5 After opening the bottle, use it within 3 months, or replace it with a new one.
*6 Prepare with ultrapure water.
*7 Protein powder should be stored in a refrigerator at - 80 ℃ before use to avoid protein degradation.
*8 This step is optional.
*9 The following steps should be used for larger samples larger than 100 g of protein, and all steps should be performed on an ice bath if not otherwise specified.
*10 The fact that the wash buffer used in the latter step is incompatible with many plastics limits the choice of centrifuge tube material.
*11 If the initial sample volume is 0.1 to 0.3 mL, add 1 mL of wash buffer, otherwise the wash buffer added must be at least 10 times more than the amount of water added in step (9).
*12 Add only 5μL of wash additive, regardless of the original sample volume.
*13 Protein precipitation does not dissolve in the wash buffer.
*14 In this state, samples can be stored at -20°C for up to one week with little protein degradation or modification.
*15 If it is too dry, it will be difficult to dissolve it again.
*16 If the precipitation is too large or too dry, it will be difficult to re-dissolve. Ultrasonic treatment can accelerate the dissolution.
*17 If it is not used for 2D-DIGE fluorescent labeling, the sample can be dissolved with IEF hydration solution in step (14), and can be stored at - 80° C for standby after dissolution, or directly for isoelectric focusing electrophoresis.
*18 Refer to the manual for more detailed process.
*19 The sediment is very small, so be careful to avoid sucking out the sediment.
*20 The absorbance reading should be completed within 40min after adding the working color solution. Unlike other methods to detect protein concentration, the absorbance of this method decreases with the increase of protein concentration.
*21 DMF shall be used within 3 months after opening the package.
*22 Dye storage solution shall be kept away from light at - 20° C and can be stable for 3 months before the expiry date.
*23 The fluorescent labeled sample can be stored for at least 3 months under the condition of dark and - 70° C .
*24 The whole process of two-dimensional electrophoresis needs shading treatment.
*25 This step is very critical. The whole operation needs to be careful. Pour a small amount of distilled water on the glass plate of the scanner, and use the clamp provided by the company to slowly place the glass plate with gel on the scanner from the end of the glass plate to avoid bubbles (bubbles will interfere with subsequent scanning).
*26 In the gel image area, the visual effect of gel protein spots can be adjusted by enlarging, shrinking, changing the /pightness and contrast.
*27 The screening threshold of differential protein points can be set in the rectangular map area, and the distribution of differential protein points can be displayed directly.
*28 In the three-dimensional map area, gel protein spots can be displayed in three-dimensional form to enhance the visualization of protein expression differences.
*29 Detailed numerical information of protein points can be displayed in the table area, including Status, Spot No., Abundance, Exclude, Volume Ratio, Picked, Max Slope, Are-a, Max Peak and Max Volume.
*30 In the protein point control panel, you can set the properties of protein points, such as the protein points to be dug (Pick), protein points of interest (POD), post-transcriptional modified protein points (PTM), and excluded protein points (Exclude).
*31 The value can be changed according to different experiments. Generally, a two-dimensional electrophoresis image contains no more than 2500 recognizable protein points, but if there are many impurity points on the gel (such as dust, dark background color, etc.), the value can be increased until the software can find all recognizable protein points.
*32 The dust pollution slope on the gel is large, the area is small, the calculated volume is small, and the peak value is low. Therefore, by arranging the corresponding item column in the table area according to the numerical value, the threshold value of the pollution point can be determined. Setting these threshold conditions can automatically remove most of the dust pollution points by the software, and other pollution points that cannot be automatically removed can be manually removed.
*33 The matching of protein points between gel can be automatically completed by the software, but if the matching result is not ideal, LandMark can be manually set to match protein points to assist the software in automatic matching. LandMark can choose about 10, and try to distribute them evenly in the whole gel. Mismatched protein points and missing matched protein points can be corrected by /peak Match and Add Match. Some single protein points are recognized as more than one protein point. Merge Sports function can be used to merge protein points, and then manually match the protein points again.
*34 Independent tests means that all samples between the control group (c) and the treatment group (t) are different individuals; Paired tests means that there is a one-to-one correspondence between the samples in the control group (c) and the treatment group (t), for example, the same patient before and after treatment.
*35 Average Ratio is used to limit the average change in protein expression between control and treated groups, with 1.1-1.2-fold change for low rigor, 1.5-fold change for medium rigor, and more than 2-fold and 2-fold change for high rigor; Student's T-test and ANOVA are used for statistical analysis of significance of differences, generally when less than 0.01, the difference is highly significant; less than 0.05, the difference is significant.
*36 Due to the low sampling volume of 2D-DIGE gel, many protein spots could not be stained by Komas /pilliant Blue. To avoid that the target proteins could not be stained, a preparation gel (the loading volume could reach 750-1000μg) was run while doing 2D-DIGE in order to dig up the target protein spots after staining.
*37 To avoid possible contamination during the operation, this operation needs to be performed in a clean environment. Place the Kaumas /pilliant Blue stained gel in ultrapure water and wear a mask and cap as well as disposable plastic gloves.