


Protocol of Mass Spectrometry Identification of Gel Separated Samples
In recent years, mass spectrometry technology has developed rapidly. With the development of mass spectrometry technology, the application fields of mass spectrometry technology are also becoming wider and wider. Due to the advantages of high sensitivity, low sample size, fast analysis speed, and simultaneous separation and identification, mass spectrometry technology is increasingly being applied in various fields of proteome research.
Mass spectrometry identification of gel separated samples is based on the method of mass spectrometry analysis of protein samples obtained after gel separation, which is the most commonly used method in mass spectrometry analysis. After decolorization → drying → enzymolysis → targeting → computer operation → data analysis, protein samples are finally identified as unknown proteins.
The purpose of this manual is to help scientific researchers understand the mass spectrometry method, master the basic principle of matrix assisted laser desorption ionization time-of-flight mass spectrometry and the mass spectrometry identification method of gel separation samples, and finally be able to use GPS Explorer software to analyze the mass spectrometry data.
Mass spectrometry is mainly a method for qualitative and quantitative analysis of samples by analyzing the mass-to-charge ratio of sample ions. A general mass spectrometer consists of four parts: an ion source, a mass analyzer, a detector, and a vacuum system. The sample is ionized into ions in the ion source, and the ions with different mass-to-charge ratio are separated in the mass analyzer. The mass spectrum of the sample can be obtained after detection by the detector. This section will use matrix assisted laser desorption ionization time of flight mass spectrometry as an example to illustrate the mass spectrometry analysis method.
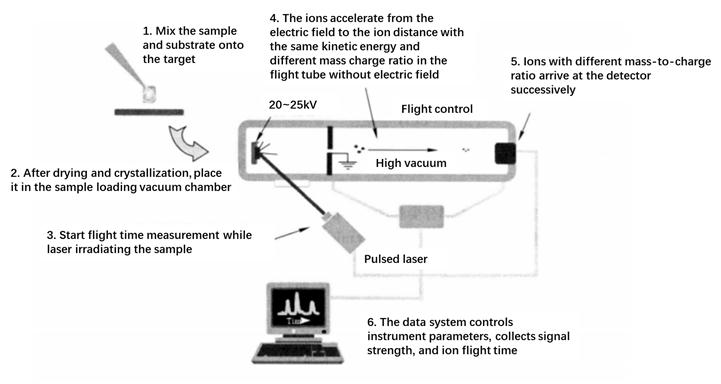
The basic principle of matrix assisted laser desorption/ionization mass spectrometry (MALDI) is to disperse analytes into matrix molecules and form crystals. When a laser is used to irradiate a crystal, the matrix molecules absorb the energy radiated by the laser, resulting in energy accumulation and rapid heat generation, leading to the sublimation of the matrix crystal, causing the matrix and analytes to expand and enter the gas phase. The mass spectra generated by MALDI are mostly single charged ions, so the ions in the mass spectra have a one-to-one correspondence with the mass of peptides and proteins. The ions produced by MALDI are usually detected by a time of flight (TOF) detector. Theoretically, as long as the length of the flight tube is sufficient, there is no upper limit to the mass number of molecules that can be detected by the TOF detector. Therefore, MALDI-TOF mass spectrometry is very suitable for studying biological macromolecules such as proteins, peptides, nucleic acids, and polysaccharides. The main process of MALDI-TOF is shown in the following figure.
To identify proteins by mass spectrometry, first determine the precise mass number of sample ions according to the measured mass-to-charge ratio, compare the mass number obtained with the mass number theoretically inferred, and then obtain the sequence information of proteins. At present, protein identification is commonly used in primary and secondary mass spectrometry. The primary mass spectrometry directly measures the mass number of sample ions. In the secondary mass spectrometry, a specific primary mass spectrometry ion will be selected as the parent ion, and the parent ion will be further broken in the mass analyzer. The composition and sequence of the parent ion will be determined by measuring the mass number of broken ions. The method of primary mass spectrometry identification is to break the protein at the known amino acid position (such as chemical break or protease hydrolysis) to produce some peptide segments with specific length and mass number. The quality information of these peptide segments corresponds to each specific protein like a human fingerprint. The spectrum of these peptide segments identified by mass spectrometry is called a peptide fingerprint, and the type of protein can be identified by comparing this spectrum with the theoretically speculated protein peptide fingerprint. The identification method of secondary mass spectrometry is to directly obtain the amino acid sequence of the peptide according to the mass number of the parent ion and the secondary spectrum.
The 4800 plus MALDI TOF/TOFTM mass spectrometer has the ability to analyze protein samples with high sensitivity and resolution in both primary and secondary mass spectrometry. After the protein sample obtained after gel separation is enzymatically hydrolyzed into peptide segments, the mass number information of the peptide segment can be obtained by first performing the primary mass spectrometry (MS). On the basis of the peptide segment information obtained by the primary mass spectrometry, the representative peptide segment can be selected for the secondary mass spectrometry to obtain detailed peptide segment sequence information. The obtained data can be compared with the database to obtain information about unknown proteins.
1. Main Instruments and Equipment
Micro pipette, mass spectrometry analyzer, centrifuge, constant temperature water bath, ultrasonic crusher, vortex oscillator, vacuum dryer.
2. Material
Coomassie Brilliant Blue staining gel protein spots.
3. Main reagents*1
| (1) Gel decolorization solution | |
| 100 mmol/L | NH4HCO3 |
| 30% | Acetonitrile |
| (2) Gel eluent | |
| 60% | Acetonitrile |
| 0.1% | TFA |
| (3) ZipTip column eluent | |
| 50% | Acetonitrile |
| 0.1% | TFA |
| (4) Substrate | |
| 5mg/mL | CHCA |
| 50% | Acetonitrile |
| 0.1% | TFA |
| (5) Calibration samples | |
| (1~3)×106mol/L | Cal Mix |
| 30% | Acetonitrile |
| 0.01% | TFA |
(6) 100% Acetonitrile
(7) 50ng/μLTrypsin
(8) 50mmol/L NH4HCO3(pH7.8~8.0)
(9) 0.1% TFA
- Scoop the target protein spot*2. Insert a 200μL pipette tip with part of the tip cut off into the gel spot position, and then use the pipette to draw the gel spot into the tip into a 1.5 mL centrifuge tube, numbered and set aside *3.
- Gel decolorization. Add 100μL of decolorization solution*4 and shake gently until the color is removed (about 15 min*5).
- Gel drying. Centrifuge at 12000 r/min for 1 min, discard the supernatant, add 100μL of 100% acetonitrile, shake gently for 5 min, then aspirate and let the acetonitrile evaporate at room temperature for about 5 min*6.
- Proteolytic digestion. Add 2μL of 50ng / μL trypsin*7 and place in a 4°C refrigerator for 60min to allow the gel block to sufficiently swell. Add 30μL of 50 mmol/L NH4HCO3(pH7.8~8.0) and react overnight (14~16h) at 37°C.
- Elute the enzymatic products. centrifuge at 12000r/min, aspirate the trypsin solution, transfer to a new 1.5mL centrifuge tube, add 100μL gel eluate to the original tube, sonicate for 15min*8, centrifuge at 12000r/min, aspirate the solution in the tube and add to the previously aspirated trypsin solution, repeat this step 3 times.
- Concentrate the solution. Combine all the aspirated liquid (including the trypsin solution and the sonicated solution) and freeze-dry until about 10μL remains (do not dry completely) *9.
- Sample purification. Purify the concentrated sample using a ZipTip® C18 column*10.
(1) The ZipTip column was wetted with 10μL of 100% acetonitrile 3 times.
(2) Then equilibrate the ZipTip column with 10μL of 0.1% TFA 3 times.
(3) The sample was drawn into the ZipTip column (about 10μL) and repeatedly aspirated and beaten 5 to 6 times, and then the liquid was beaten out.
(4) Wash with 10μL of 0.1% TFA 3 times to remove impurities.
(5) The sample was eluted with ZipTip column eluent (about 1μL) and repeatedly aspirated and beaten 5 to 6 times, and a large amount of purified sample was dissolved in the eluent and set aside.
- Spot the target. Mix the purified sample with 1μL of 5 mg/mL CHCA and spot onto a clean and dry MALDI sample target*11.
- Mass spectrometry identification
(1) Power on*12
① After turning on the power to the left and right sides of the mass spectrometer and the mechanical vacuum pump, the hardware starts to initialize and the mechanical vacuum pump starts to operate about 10 min after the molecular pump starts to operate. It takes about 24h to reach the minimum vacuum level required for the mass spectrometry work after the power on.
② Turn on the computer monitor, enter the user's name and password to enter the operating system, double click the  icon on the desktop to open the software and initialize the hardware.
(2) Software usage
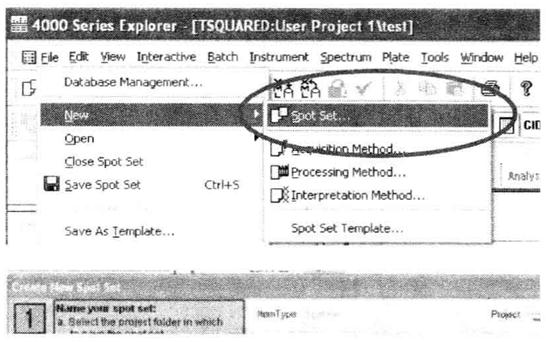
First of all, to create Spot Set, used to store methods and data, File → New → Spot Set → New Project → Item Name → Plate Name → Select a Spot Set Template *13, after setting the parameters, named to save.
(3) Loading sample targets
Place the sample target to be loaded in the left injection chamber. If the sample chamber in the machine is empty, you can directly select Load Plate to load the sample target into the sample chamber. If there are sample targets in the sample bin, two loading methods can be selected. The first method is to first select Eject Plate, withdraw the sample target from the sample bin, and then select Load Plate to send the sample target to be loaded into the bin.
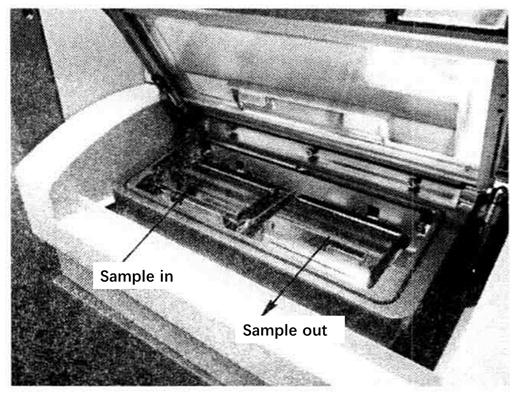
The second method can be directly selected as Load Plate *14. The program will first withdraw the sample target from the chamber, and then automatically load the sample target from the injection chamber into the sample chamber.
(4) Establishment of the method
To establish the acquisition method*15, File → Open → Acquisition Method → All Objects → MS Re-flection Positive*16 (primary mass spectrometry). Create the acquisition method for the secondary mass spectrum in the same way. Set the parameters as follows:
① Total number of primary MS laser strikes: 1000.
② Total number of secondary MS/MS laser hits: 2000 to 2500.
③ Collision energy 2 kV, CID off.
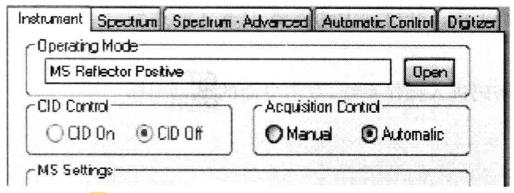
Create the processing method*17, File → Open → Processing Method → All Objects → Reflector Positive Inernal (primary mass spectrum). Similarly, create the processing method for secondary mass spectra.
(5) Mass number calibration
Mass number calibration is performed using Cal Mix standard samples. For primary mass spectrometry, a single standard sample point calibration can be done when the number of samples is small. For whole target samples, a batch standard sample point calibration is required. For secondary mass spectra, only single standard sample point calibration*18 can be done.
(6) Setting up association files for primary and secondary mass spectra
Through an Interpretation correlation file setting method, the parent ions are automatically selected from the primary mass spectra for the secondary mass spectra, generally 10 parent ions are selected.
(7) Run to acquire data
Run the program in Spot Set → Job to acquire mass spectrometry data.
(8) Mass spectrometry data analysis*19
Use the GPS ExplorerTM software to identify the results obtained by the mass spectrometer.
① Click the icon ![]() to open the software*20.
to open the software*20.
② Click the ![]() icon to enter the Sample Setup window.
icon to enter the Sample Setup window.
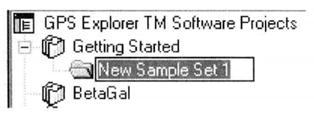
③ Create a new Project in GPS ExplorerTM Software Projects section named Get-ting Started.

④ Create a new New Semple Setl under New Project and name it BSA.
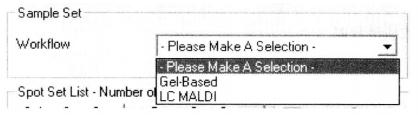
⑤ In the Semple Set dialog box, Workflow selects Gel-based*21.
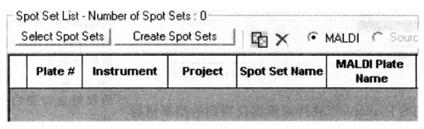
⑥ In the Spot Set List dialog box, click "Select Spot Sets".
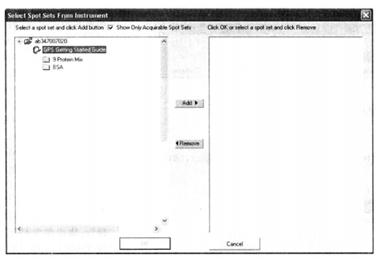
⑦ Select the Spot Set file you want to analyze in the left directory, click Add, and save the settings.
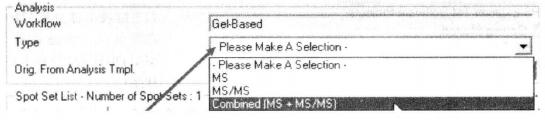
⑧ Select Combined [MS + MS/MS] in the Analysis column *22.
⑨ Click "Analysis Setting" on the right side of "Orig. From Analysis Spot Sets" to enter the analysis settings page.
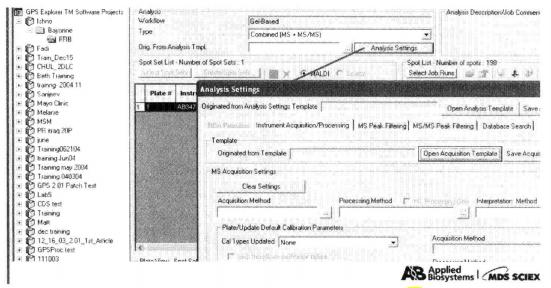
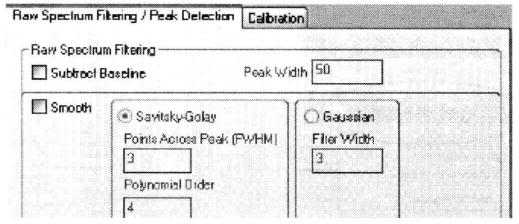
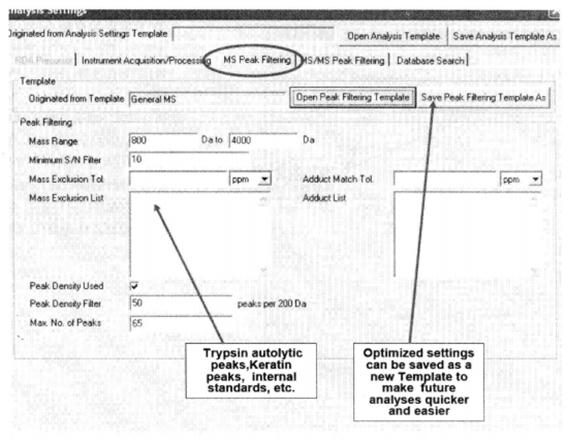
⑩ Set the primary mass spectrometry peak screening condition*23.
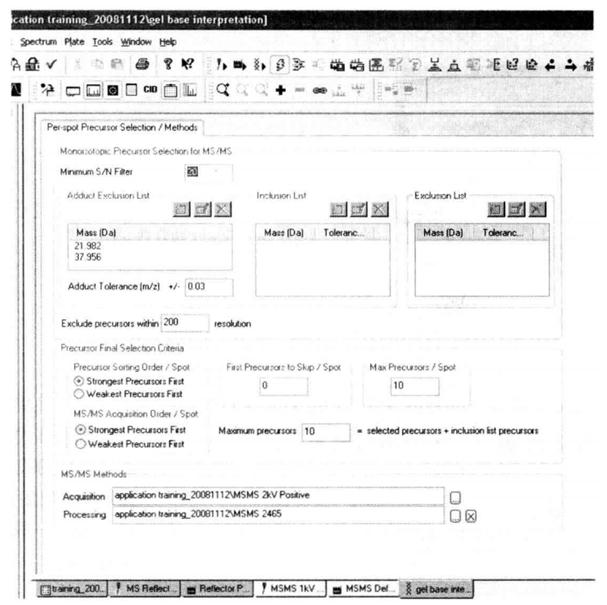
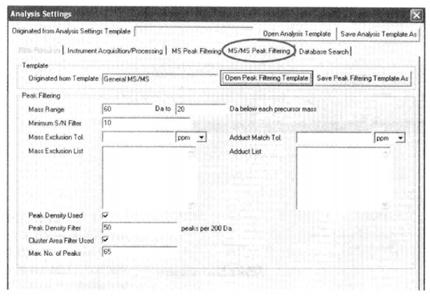
⑪ Set secondary mass spectrometry filtering conditions*24.
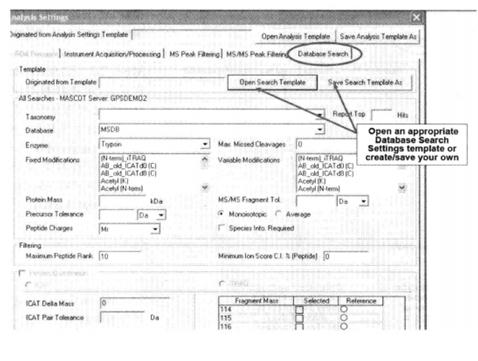
⑫ Set the database search criteria
⑬ Click the Submit button ![]() to perform a database search.
to perform a database search.
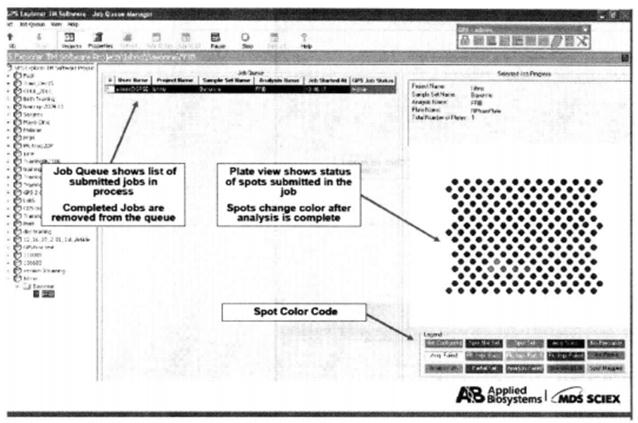
⑭ Monitor the status of the task in the Job Manager window*26.
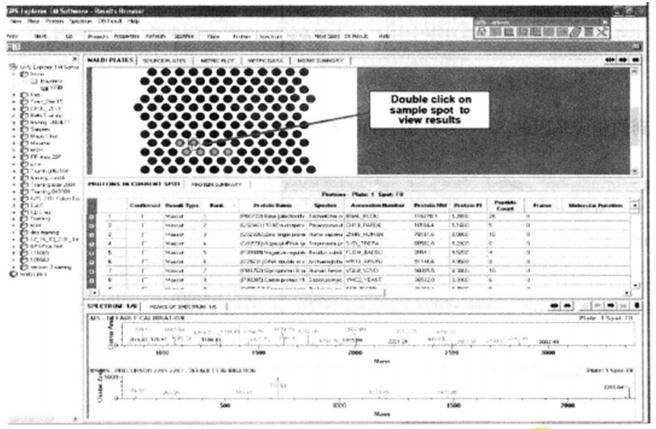
⑮ In the Result window, click on the corresponding point on the target to view the database search results for that point*27.
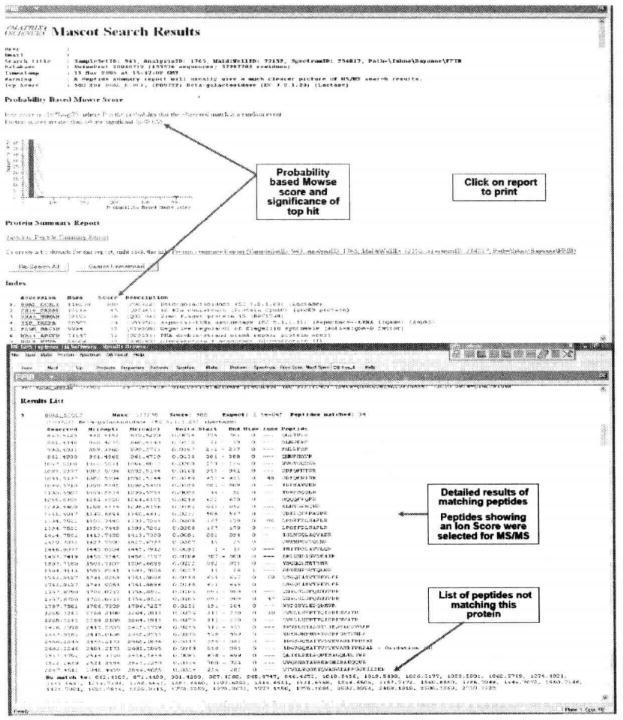
⑯ Click the "DB result" button in the toolbar to view the results of the Mascot search*28.
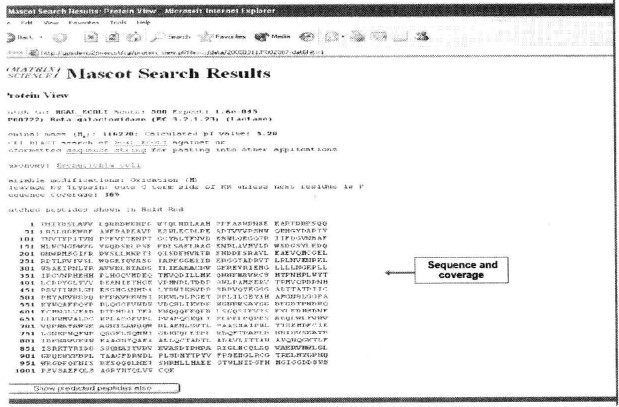
⑰ Click on the Accession link of the corresponding gene under Index to view the sequence coverage of the primary mass spectra.
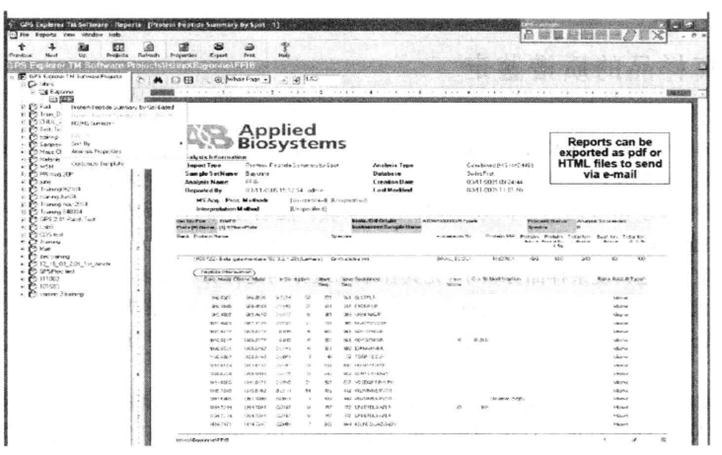
⑱ Go to the Report window to generate a report of the results*29.
1. During the mass spectrometry operation, the pipette tips and the 1.5 mL centrifuge tubes used need to avoid contamination by polymers. Hats, gloves and masks must be worn to avoid contamination of protein samples by the experimenter's own keratin.
2. The salt content of the sample can be controlled by changing the NH4HCO3 concentration to reduce the salt ion content. Salt ion concentration directly affects the degree of sample ionization, which in turn affects the results of mass spectrometry.
3. It is better not to store the sample and perform the mass spectrometry directly. The longer the sample is stored, the more likely it is to decompose.
4. Make backup copies of the mass spectrometry data in a timely manner.
*1 The reagents used for the mass spectrometry experiments were of HPLC grade. The water used was ultrapure water.
*2 A mask and gloves must be worn throughout the mass spectrometry operation to ensure that the sample is not contaminated.
*3 If the next operation is not performed, the samples can be stored in a refrigerator at -80°C for a short period of time.
*4 Decolorization solution is not used for a long time, the decolorization efficiency is reduced, and the decolorization time can be extended.
*5 The decolorization time is longer for protein spots with heavy coloring.
*6 This step should be performed in a fume hood. Acetonitrile is hazardous to health and requires extra care.
*7 Try to avoid staining of trypsin on the skin.
*8 The purpose of sonication is to allow sufficient precipitation of the enzymatically digested peptides.
*9 If the next step is not performed, the concentrated solution can be stored briefly at -20°C.
*10 The use of this column removes a large amount of salt ions and serves to further concentrate the sample.
*11 The target can also be spotted in such a way that the sample is spotted first, and then the matrix is spotted after the sample is completely dry.
*12 The mass spectrometer should not be switched on and off repeatedly to avoid reducing the service life. In principle, always keep it on while ensuring power supply.
*13 In this step, Template is selected according to the sample, which is generally divided into two kinds. One choice is the mechanical 384 target, and the other is the user-defined target.
*14 The direct selection of Load Plate is generally more commonly used.
*15 The way of data acquisition, including the setting of the operation mode, the setting of the laser hitting the sample, etc., please refer to the instruction manual for the specific settings.
*16 Reflectance mode is often used for primary mass spectrometry.
*17 Set up the processing method for the acquired data.
*18 For point calibration, you need to save the calibration data manually. For batch calibration, you do not need to save the calibration data manually.
*19 The computer with GPS Explor-erTM software can be directly connected to the computer of the AB4800 mass spectrometer via a network cable to process the raw data obtained from the mass spectrometer and perform protein search analysis on the data obtained from the mass spectrometer with the integrated Mascot software.
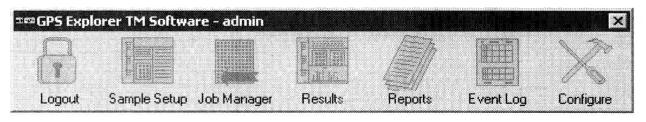
*20 There are eight main windows, including the Log In/Log Out window for entering and exiting the software, the Sample Setup window for creating a new Project, creating a new Sample Set, creating a new Analy-sis, and submitting an Analysis, and the Job Man-ager window for monitoring the status of submitted tasks. The Result Browser window allows you to open a Sample Set and perform analysis, for Gel-Based Analysis, to view the results of a single point, for LC MALDI Analysis, to view the results of each protein, and to view the results of a Mascot database search. The Event Log window records the events of the software run, and the Configure window allows you to set some properties of the software.
*21 There are two working modes, one based on Gel-Based (samples are from protein spots after gel electrophoresis separation) and one based on LC MALDI (samples after LC separation).
*22 Among the analysis types, MS refers to primary mass spectrometry, MS/MS refers to secondary mass spectrometry, and Com-bined [MS + MS/MS] refers to combined primary mass spectrometry and secondary mass spectrometry.
*23 Usually the relative molecular mass of peptides obtained by trypsin digestion is 800~4000, for peptides obtained by other means, the mass number screening conditions can be set according to the specific situation. Mass Exclude Tol means to exclude the allowable error of mass number, you can choose relative error "ppm" or absolute error "Da", and the exclusion list can list trypsin Adduct Match Tol refers to the allowable error of adduct match, either "ppm" or "Da" for relative or absolute error, and the list of adducts can list the adducts The adducts can be listed in the list of adducts, e.g. 21.982 (=NaCl). The search efficiency can be improved by setting the "Peak Density Filter" and "Max No. of Peaks".
*24 A single parent ion broken in secondary mass spectrometry forms a series of molecules with mass numbers from one amino acid residue to the parent ion minus one amino acid molecule, so it can be set to 60 Da to the parent ion minus 20 Da. The rest of the settings are similar to the principle of primary mass spectrometry screening.
*25 Select the classification of the species in Taxonomy, the finer the classification, the smaller the database size and the faster the search. select the enzyme used for enzymatic protein digestion in Enzyme. In Fixed Modifications, select modifications that are common to all peptides, e.g., proteins are alkylated in protein spots obtained by bi-directional electrophoresis. In Variable Modifications select the modifications that the peptide may have, e.g. phosphorylation modifications, glycosylation modifications, etc.
*26 On the right side of the monitoring window, the points where the data search is complete change color to show the progress of the search.
*27 Click on the corresponding sample point to get the corresponding peptide information. In the spectrum information, the red peak lines represent the peptide peaks that match the database.
*28 The software automatically produces a confidence statistic for the best matching protein result with a score (score) at p<0.05, then the larger this score is, the more reliable the search result is.
*29 The results can be generated as a pdf file to be saved in the computer or printed out directly.