


Guide of Analysis of Differentially Expressed Proteins by Two-dimensional Electrophoresis
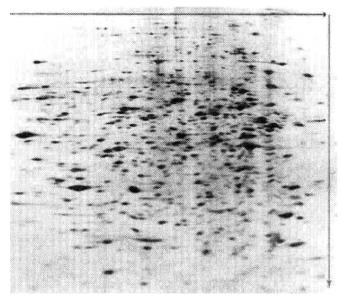
Two-dimensional electrophoresis refers to isoelectric focusing electrophoresis in the first direction and SDS-PAGE in the second direction. After the charge and relative molecular weight of the sample are separated twice, the isoelectric point and relative molecular weight of the molecule can be obtained. The result of separation is not a band, but a point. According to the Csrtesin coordinate system, from left to right is the increase of pI, and from bottom to top is the increase of relative molecular weight. This is the technology with the highest resolution and the most information among all electrophoresis technologies. In recent years, it has become the most valuable core method for proteome research through various improvements.
Using two-dimensional electrophoresis to find protein differences is one of the most important and common methods to study differentially expressed proteins. This experimental manual focuses on the main methods of two-dimensional electrophoresis, the analysis methods of differential proteins and the optimization of parameters.
Master the basic principle and main steps of analyzing differentially expressed proteins by two-dimensional electrophoresis, master the operation method of two-dimensional electrophoresis and the application of ImageMaster analysis software.
First direction isoelectric focusing: isoelectric focusing (IEF) is to add a substance called an amphoteric electrolyte carrier to the gel column, so that the gel column can form a stable, continuous and linear pH gradient in the electric field. From the perspective of electrophoresis, the most important characteristic of protein is its charged behavior. They carry different amounts of positive or negative charges in different pH environments. Only at a certain pH, the net charge of protein is zero, and this pH is the isoelectric point (pl) of the protein. In the electric field, protein molecules move to the positive electrode in the form of anions in the pH environment greater than their isoelectric point, and to the negative electrode in the form of cations in the pH environment less than their isoelectric point. If the mixed samples of proteins containing various isoelectric points are electrophoretic in the pH gradient environment, regardless of the original distribution of the mixed protein molecules, they will be aggregated at a certain position of the pH gradient according to their respective isoelectric point size. The net charge of the protein point at the focus site is zero, and the isoelectric point of the protein can be determined by measuring the pH of the focus site.
Second direction SDS polyacrylamide gel electrophoresis: SDS is an anionic surfactant. When sufficient SDS is added to the protein solution, the protein SDS complex can be formed, which changes the charge and conformation of the protein. SDS reduces the disulfide bond of protein molecules, and makes various protein-SDS complexes carry negative charges of the same density, and its amount greatly exceeds the original charge amount of protein molecules, thus covering the original natural charge difference between different proteins. In terms of conformation, the protein SDS complex forms a long oval bar similar to a cigar. The migration of such protein SDS complex in the gel is no longer affected by the original charge and shape of the protein, but only depends on the size of the relative molecular weight, so we can determine the relative molecular weight of the protein through SDS polyacrylamide gel electrophoresis (SDS-PAGE).
1. Main Instruments and Equipment
Micro-pipette, vertical electrophoresis instrument, horizontal electrophoresis instrument, low-temperature circulating water bath, decolorization shaking table, scanning instrument, ImageMaster 2D Platinum Version 5.0 software.
2. Material
The prepared protein sample.
3. Main reagents*1
(1) Lysis solution*2
| Urea | 7mol/L |
| Thiourea | 2mol/L |
| CHAPS | 4% |
| DTT | 100 mmol/L |
(2) Hydration solution
| Urea | 8mol/L |
| CHAPS | 2% |
| DTT*3 | 20 mmol/L |
| IPG buffer*4 | 0.5% or 2% |
| Bromophenol blue | 0.002% |
(3) Balanced buffer*5
| Urea | 6mol/L |
| Tris-HCl (pH 8.8) | 75 mmol/L |
| Glycerol (87%) | 29.3% |
| SDS | 2% |
| Bromophenol blue | 0.002% |
(4) Bind-silane working solution*6
| Ethanol | 3.2mL |
| Glacial acetic acid | 80μL |
| Bind-silane | 4μL |
| Deionized water | 0.72mL |
(5) Capped agarose solution
| Agarose | 0.2% |
| Bromophenol blue | 0.002% |
1. Sample loading. The loading volume of the 24 cm adhesive strip is approximately 750-1000μg of protein sample*7, and the total volume mixed with the hydration solution is 450μL.
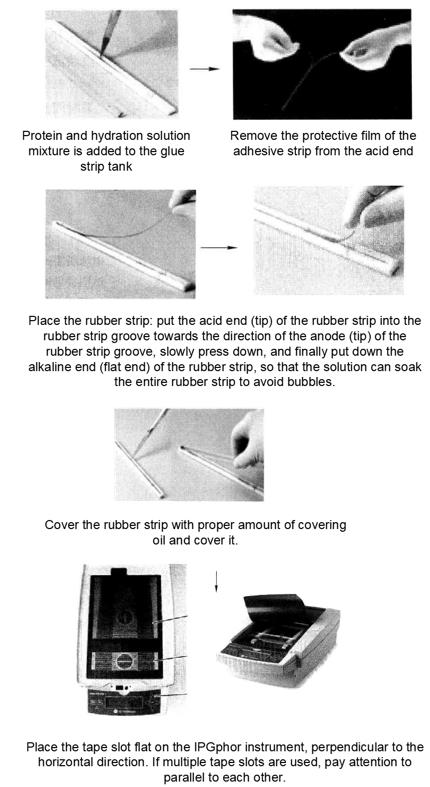
2. First direction isoelectric focusing*8. Set the operating parameters of the IPGphor instrument. The operating temperature is 20°C, the maximum current per glue strip is 50μA, and the following voltage settings are shown.
| Voltage / V | Boost mode | Electrophoresis time/h |
| 30 | step-n-hold | 12 |
| 100 | step-n-hold | 1 |
| 1000 | step-n-hold | 1 |
| 8000 | gradient | 2 |
| 8000 | step-n-hold | 55000 Vh*9 |
| 500 | step-n-hold | 5 |
3. Balance from one direction to two directions*10
(1) Put the rubber strip into 20mL balanced buffer I (including 1% DTT *11) for sealing, and shake it on the shaking table for 15min.
(2) Take out the adhesive strip and put it into 20mL balanced buffer II (containing 2.5% iodoacetamide) to seal, and shake it on the shaking table for 15min*12.
(3) Rinse the adhesive strip with the newly prepared electrophoresis buffer, place the edge of the adhesive strip on the filter paper for several minutes to remove the excess liquid, and prepare for the second direction gel electrophoresis.
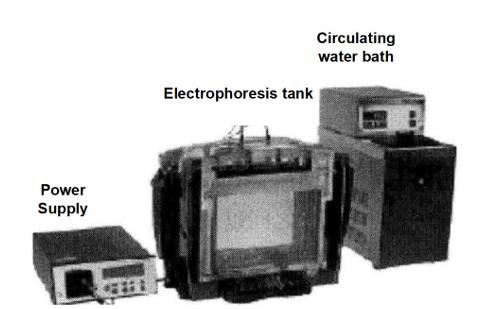
4. Two-way electrophoresis (SDS-PAGE)
Two-way electrophoresis device is shown below, including power supply, electrophoresis tank and circulating water bath.
(1) Add the prepared bind silane working solution to the glass plate evenly, wipe it evenly with dust-free paper, and generally repeat the wiping for three times. After each wiping, dry it before the next wiping. The glass plate can be used to pour gel*13 after drying for 2h at room temperature.
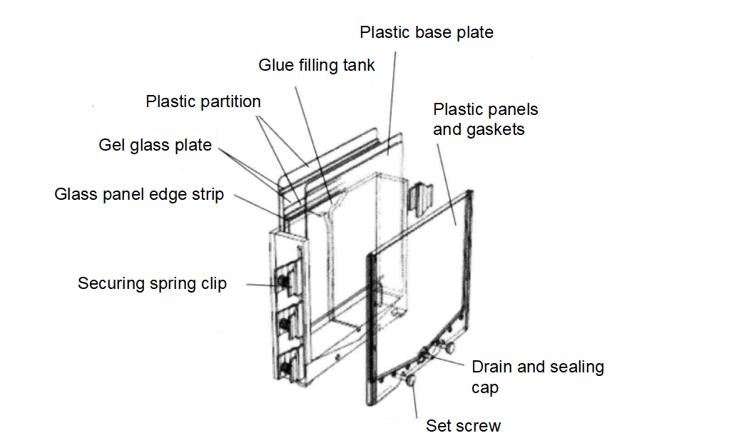
(2) Filling mold *14, as shown in the figure below:
(3) Prepare gel solution*15 according to the following ingredients. After ultrasonic degassing for 5min, add TEMED and ammonium persulfate, mix well, and then pour glue, and then seal with water.
| Monomer stock solution | 166.8mL |
| 4 × Separating gel buffer | 100mL |
| 10%SDS | 4mL |
| Deionized water | 127.2mL |
| TEMED | 132μL |
| 10% ammonium persulfate | 2000μL |
| Total volume | 400mL |
(4) Before electrophoresis, open the mold, wash the glass plate with deionized water, and wash the gel surface with electrophoresis buffer more than 3 times.
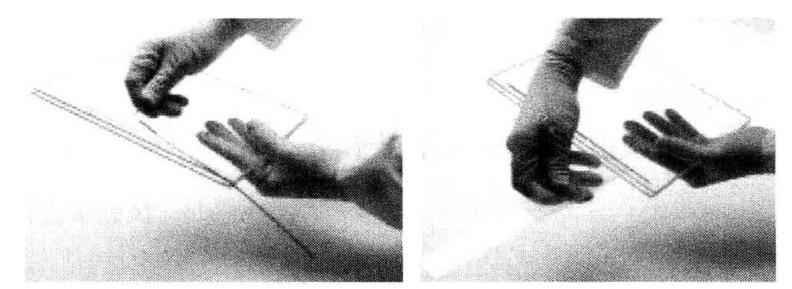
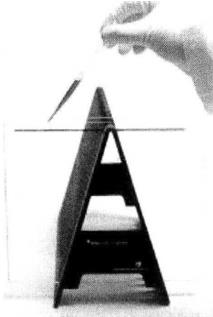
(5) Place the balanced adhesive strip on the gel surface between the glass plates, make the adhesive strip support film stick to one of the glass plates, and use a thin ruler to gently push down the IPG adhesive strip (as shown in the figure below), so that the lower edge of the entire adhesive strip is fully in contact with the upper surface of the plate adhesive. Ensure that there are no bubbles between the IPG adhesive strip and the plate adhesive and between the glass plate and the plastic support film.
(6) After mixing the standard relative molecular weight protein solution with the same volume of 1% agarose solution, add it to the filter paper. After solidification, add it to the gel surface.
(7) Finally, use 1~1.5mL of 0.2% agarose sealing solution containing a small amount of bromophenol blue to seal the top, so that the IPG adhesive strip is completely covered, and no bubbles are generated during this process.
(8) Perform two-dimensional electrophoresis (SDS-PAGE), and the electrophoresis parameters are set as follows:
| 3 W/gel | 45min |
| 17 W/gel | to bromophenol blue to the bottom of the gel |
5. Gel staining
In order to be compatible with mass spectrometry, the method of Coomassie brilliant blue is often used.
6. Gel Scanning
Use the scanner to scan the dyed gel and store it as a Tif format file for backup.
7. Analysis of two-dimensional electrophoresis
The general process of two-dimensional electrophoresis pattern analysis is to obtain gel images. Adjust and calibrate the gel image. Identification and quantification of protein points. Annotate protein dots and pixels. Match the gel image. Analyze, consolidate data and report results. This process inspects and analyzes the results of two-dimensional electrophoresis of proteins to determine the direction of the next experiment. The application software is ImageMaster 2D Platinum Version 5.0.
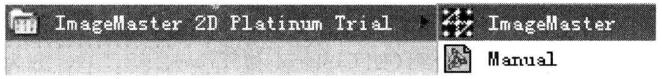
(1) Start software: program → ImageMaster 2D Platinum → ImageMaster
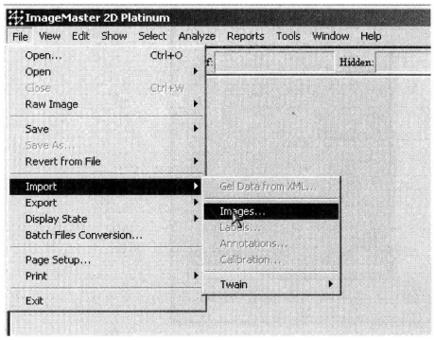
(2) Import the gel image: File → Import → Images. The selected image format is generally Tif or Gel format *17.
(3) Create a new Workspace (click ![]() ) and Project (click
) and Project (click ![]() ) *18
) *18

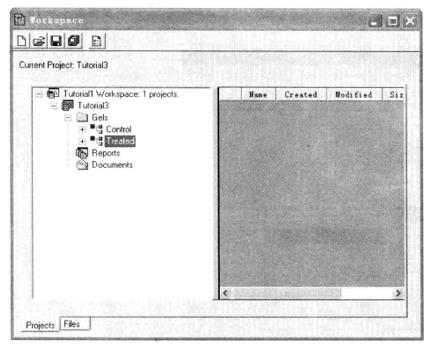
(4) Group the gel *19: right click "Gels" → Add new class → group (such as Control and Treated) → select a group, right click → group the imported image. As shown in the following figure: Control group and Treated group.
(5) Image adjustment*20: Execute View → Adjust Contrast → Current. To adjust multiple pieces of glue together, first select → Gels → All or Ctrl+A/B. When adjusting a single piece of glue, left-click the upper edge of the glue to turn green. During coarse adjustment, you can drag the slider bar in the figure below with the mouse. During fine adjustment, you can adjust it by entering accurate values in the input boxes on both sides. "Bending" is used to lower the background, making it easier to observe the point visually. Select ![]() and then glue to enlarge the image. Select
and then glue to enlarge the image. Select ![]() to move the glue position. Double-click a point in the image to adjust multiple pieces of glue to the same position.
to move the glue position. Double-click a point in the image to adjust multiple pieces of glue to the same position.
(6) Point finding*21: Select ![]() , select an area with dense and clear protein points on the image, and perform the Edit → Spots → Auto-detect → Current operation. The software will find points in the selected area. After that, check the effect of automatic point finding. Adjust the point finding parameters according to the situation of the area. "Smooth" represents the smoothness of the outer edge of the protein point. The higher the value, the closer the outer edge of the protein point is to the circle, But if it is set too high, it is easy for the program to consider multiple points as one. "Min Area" is the minimum area of protein spots. Points with an area less than this value are filtered out, and this value can be used to remove dust and other miscellaneous spots.
, select an area with dense and clear protein points on the image, and perform the Edit → Spots → Auto-detect → Current operation. The software will find points in the selected area. After that, check the effect of automatic point finding. Adjust the point finding parameters according to the situation of the area. "Smooth" represents the smoothness of the outer edge of the protein point. The higher the value, the closer the outer edge of the protein point is to the circle, But if it is set too high, it is easy for the program to consider multiple points as one. "Min Area" is the minimum area of protein spots. Points with an area less than this value are filtered out, and this value can be used to remove dust and other miscellaneous spots.
(7) Matching of different glue protein spots:
① Reference glue setting*22: Execute Edit → Groups → SetReference Gel
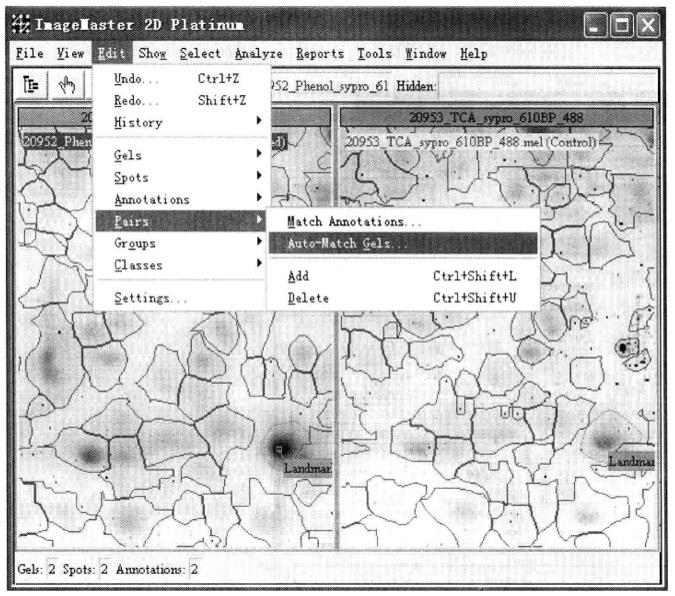
② Protein point matching: first select the marker protein point*23 (Landmark) as the reference for the software to match different gel. Landmark can select multiple. Click ![]() , select the protein point with the left mouse button, and click "Shift+left mouse button" to select the protein point matching the point on other glue, and execute Edit → Annotations → Add Label → Landmark → OK. After selecting Landmark, perform gel matching: Execute Edit → Pairs Edit → Auto Match Gels*24.
, select the protein point with the left mouse button, and click "Shift+left mouse button" to select the protein point matching the point on other glue, and execute Edit → Annotations → Add Label → Landmark → OK. After selecting Landmark, perform gel matching: Execute Edit → Pairs Edit → Auto Match Gels*24.
(8) Data report
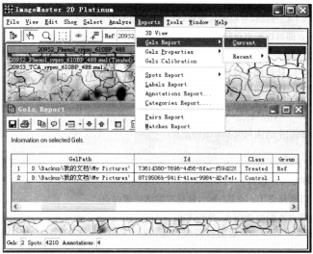
① Gel information: select all gel and protein spots, and click Report → Gels Report → Current.
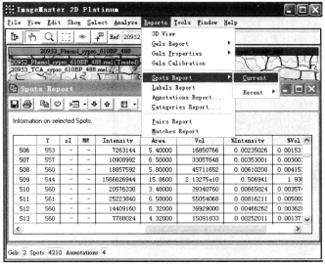
② Protein spot information: select all gel and protein spots, and click Report → Spots Report → Current.
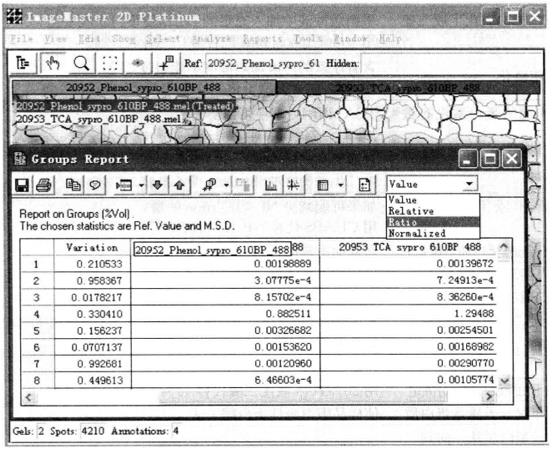
③ Observe the change of magnification: select all gel and protein spots, and execute Analyze → Groups Report.
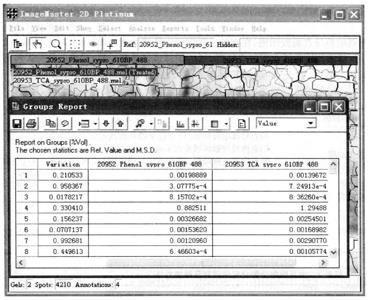
④ The difference between glue and glue. On the upper right of the dialog box of the Groups Report, select Ratio from the drop-down box, that is, you can see the ratio of the signal strength of the matching point at the other glue to the reference glue.
(9) Data output: All results can be copied to Word, Excel, PowerPoint and other software by clicking![]() .
.
8. Digging of differential protein points*25
Referring to the difference spot gel atlas obtained by ImageMaster software, find the protein spot at the corresponding position on the gel, insert a 200μL pipette tip with part of the tip cut off into the gel spot position, then use the pipette to draw the gel spot into the tip, put it into a 1.5 mL centrifuge tube, and store it in a -80°C refrigerator.
Addendum 1 Common problems and solutions in isoelectric focusing.
| Phenomenon | Possible causes | Solutions | |
| Current too low or zero | Power connection failure |
|
|
| The voltage is too low or the predetermined maximum voltage is not reached | The isoelectric focusing parameters are not set correctly | Check whether the current limit is set correctly. Check whether the actual number of strips of electrophoresis is consistent with the number of strips set in the method. |
|
| High conductivity or ionic strength | Treat the sample so that the salt concentration of the sample is lower than 10mmol/L. The recommended concentration of IPG buffer is 0.5%. If there is a problem with the dissolution of the sample, the maximum concentration can reach 2%. |
Addendum 2 Common problems and solutions of vertical plate electrophoresis.
| Phenomenon | Possible causes | Solutions |
| SDS gel vertical trailing | Protein is not fully encapsulated by SDS | Balance buffer SDS concentration>1%, balance time 2 × 15min. |
| Glycoprotein | Replace Tris buffer with boric acid buffer. Use a wide range of small pore gradient adhesive. Protein disaccharylation. |
|
| Partial free sulfhydryl group is oxidized again to form disulfide bond polymer | Add sufficient DTT into the balanced buffer to alkylate the protein. Substitution of DTT and iodoacetamide with distributylphosphine. |
|
| Carbamylation of protein | The heating temperature of solution containing urea shall not exceed 37°C. Deionize urea before use. |
|
| During sample preparation, endogenous protease was not inhibited | TCA-acetone treatment inactivates protease. Boil with SDS or protease inhibitor. |
|
| Dust or excess DTT | Filter all buffer. The second step is to add iodoacetamide to the balance buffer to remove the excess DTT. |
|
| Part of the map is deformed | The concentration of NP-40 or Triton X-100 in IPG adhesive strip is too high | If possible, reduce the amount of NP-40/Triton. Replace NP-40/Triton with CHAPS. |
| Only little (or no) protein can be seen on SDS gel | Improper sample preparation method (low protein concentration) | Before two-dimensional electrophoresis, estimate the protein concentration in the sample. |
| Inadequate protein entry into IPG strip | Start IEF with low electric field intensity. | |
| Poor combination between IPG adhesive strip and SDS adhesive | Lightly press the IPG adhesive strip to fully combine it with SDS adhesive. | |
| Low efficiency of protein transfer from one direction to two directions | Use low electric field intensity for protein transfer. Use detergent to improve the solubility of protein. | |
| Incorrect silver staining method | Inspection method. | |
| Formaldehyde oxidation | Use new formaldehyde. | |
| Loss of low or high relative molecular weight protein | Low relative molecular weight protein is not sufficiently fixed | Replace 40% ethanol and 10% acetic acid with 20% TCA or glutaraldehyde. |
| Protease degradation of high relative molecular weight protein | Deactivate the endogenous protease in the sample. | |
| The transfer efficiency of high relative molecular weight protein from one direction to two directions is low | Protein transfer with low electric field intensity. | |
| The background of gel is dirty | No inactivation of endogenous protease in the sample | Deactivate the endogenous protease in the sample. |
| Insufficient cleaning steps in silver dyeing | Perform sufficient cleaning steps. | |
| Complex formed by amphoteric electrolyte and SDS or other detergent | The adhesive fixation time is>3h or overnight, and the compound is fully cleaned and removed. | |
| Poor reagent quality | Use analytical grade or better reagent. | |
| Poor quality of water | Conductivity < 2 μS. | |
| The hydration tray or rubber strip groove is polluted by protein | Thoroughly clean the hydration tray or rubber strip groove. |
1. Ion is a relatively large interference factor in the process of isoelectric focusing electrophoresis, which can lead to excessive current, and the voltage cannot reach the specified voltage in the process of rising, resulting in incomplete separation of proteins. Therefore, the introduction of ions should be avoided as much as possible during the experiment. For example, the determination of protein extraction method, use of ultra-pure water, etc.
2. If the protein points separated by two-dimensional electrophoresis need to be identified by mass spectrometry, attention should be paid to the selection of staining methods that do not interfere with mass spectrometry, such as the Coomassie brilliant blue method.
3. Repeatability is one of the problems needing attention in two-dimensional electrophoresis, so the consistency of reagents, operation process, experimental conditions and sample preparation methods should be maintained in the operation process to ensure the repeatability of two-dimensional electrophoresis and obtain reliable results.
*1 The main reagent is only the reagent required for electrophoresis.
*2 Only one common cracking liquid is listed here. During the experiment, other suitable cracking liquid can be selected according to the sample requirements.
*3 DTT and IPG buffers need to be freshly prepared and added before use.
*4 Select the appropriate IPG buffer according to the adhesive strips with different pH ranges, and refer to the specific operating instructions for the use concentration.
*5 Before use, add DTT to the final concentration of 1% or iodoacetamide to the final concentration of 2.5% for the first and second balance, respectively.
*6 The solution shall be prepared in a fume hood. This 4mL can be coated with a glass plate three times.
*7 This section takes 24cm adhesive strip as an example for discussion. The sample loading amount can be determined according to the dyeing method.
*8 Electrophoresis is mainly based on the volt hour (Vh). There are different reference values for the voltage setting of strips with different lengths and different pH ranges, which can be set according to the operation manual (this section is for the parameter setting of 24cm long strips).
*9 After this step reaches 55000 Vh, proceed to the next step or terminate the isoelectric focusing.
*10 The purpose of balance is to make protein molecules fully interact with SDS to ensure smooth migration in the second direction.
*11 DTT and iodoacetamide should be added into the balance buffer storage before use.
*12 Pay attention to the balance time. If the time is too short, it will affect the efficiency of protein transfer from IPG to SDS. If the time is too long, the isoelectric focusing band will diffuse.
*13 This step is recommended to be carried out in the fume hood.
*14 The mold filled with glue can be used to prepare 6 pieces of gel at one time.
*15 The concentration of this gel is 12.5%.
*16 The images saved by ordinary scanners are mostly in Tif format, and the images saved by Typhoon 9400 scanners are mostly in Gel format.
*17 Name according to the sample.
*18 It is divided into control group and treatment group, and the repetition of samples in each group should be guaranteed at least 3 times for statistical analysis.
*19 Make the protein spots on the gel easy to observe and find, without changing the true signal value of the protein spots.
*20 The points automatically found by the software sometimes cause errors, such as two points being mistaken for one point, or one point being mistaken for two points, or missing some points. These mistakes are solved by manual correction.
*21 Set the reference glue. Generally, the image is clear and there are many protein spots.
*22 Generally, the points that are relatively clear and can accurately find the matching points in several pieces of glue are set as Landmark.
*23 If there is a problem with automatic matching, manual correction can be performed. The following operations can be performed: cut, expand, merge, add and delete.
*24 In order to avoid possible pollution during operation, this operation needs to be carried out in a clean environment. Put the gel dyed with Coomassie brilliant blue into ultrapure water, and wear a mask, hat and disposable plastic gloves.