


Recombinant Human C20orf196, GST-tagged
| Cat.No. : | C20orf196-10497H |
| Product Overview : | Recombinant Human C20orf196 protein, fused to GST-tag, was expressed in E.coli and purified by GSH-sepharose. |
| Availability | July 22, 2026 |
| Unit | |
| Price | |
| Qty |
- Specification
- Gene Information
- Related Products
- Citation
- Download
| Species : | Human |
| Source : | E.coli |
| Tag : | GST |
| Protein Length : | 1-141a.a. |
| Storage : | The protein is stored in PBS buffer at -20℃. Avoid repeated freezing and thawing cycles. |
| Storage Buffer : | 1M PBS (58mM Na2HPO4,17mM NaH2PO4, 68mM NaCl, pH8. ) added with 100mM GSH and 1% Triton X-100,15%glycerol. |
| Gene Name | C20orf196 chromosome 20 open reading frame 196 [ Homo sapiens ] |
| Official Symbol | C20orf196 |
| Synonyms | C20ORF196; chromosome 20 open reading frame 196; uncharacterized protein C20orf196; FLJ25067; RP4-784N16.1; |
| Gene ID | 149840 |
| mRNA Refseq | NM_152504 |
| Protein Refseq | NP_689717 |
| UniProt ID | Q8IYI0 |
| Chromosome Location | 20p12.3 |
Shieldin complex promotes DNA end-joining and counters homologous recombination in BRCA1-null cells
Journal: Nature cell biology PubMed ID: 30022119 Data: 2018/9/14
Authors: Harveer Dev, Ting-Wei Will Chiang, Stephen P. Jackson
Article Snippet:Gluathione sepharose beads (GE Healthcare) were washed with ice-cold PBS and blocked for 30min with PBS supplemented with 10% bacterial lysate (non-induced BL21 cells, lysed using PBS/lysozyme) then resuspended in binding buffer (10mM Tris pH7.5, 150 mM NaCl, 0.5% NP40, 0.5 mM EDTA, 0.5 % BSA).Gluathione sepharose beads (GE Healthcare) were washed with ice-cold PBS and blocked for 30min with PBS supplemented with 10% bacterial lysate (non-induced BL21 cells, lysed using PBS/lysozyme) then resuspended in binding buffer (10mM Tris pH7.5, 150 mM NaCl, 0.5% NP40, 0.5 mM EDTA, 0.5 % BSA).. Purified GST (bacterial expression), GST-FAM35A (Novus Biologicals), and His-C20orf196 (Creative BioMart) were added to the beads at 2 pmol and incubated for 30min at 4°C.. Beads were washed 5x with 10 mM Tris, pH 7.5, 250 mM NaCl, 0.5 % NP40, 0.5 mM EDTA and eluted with 100 mM Tris pH 8, 20 mM reduced glutathione, 120 mM NaCl for 15min rotating at 4°C.Beads were washed 5x with 10 mM Tris, pH 7.5, 250 mM NaCl, 0.5 % NP40, 0.5 mM EDTA and eluted with 100 mM Tris pH 8, 20 mM reduced glutathione, 120 mM NaCl for 15min rotating at 4°C.
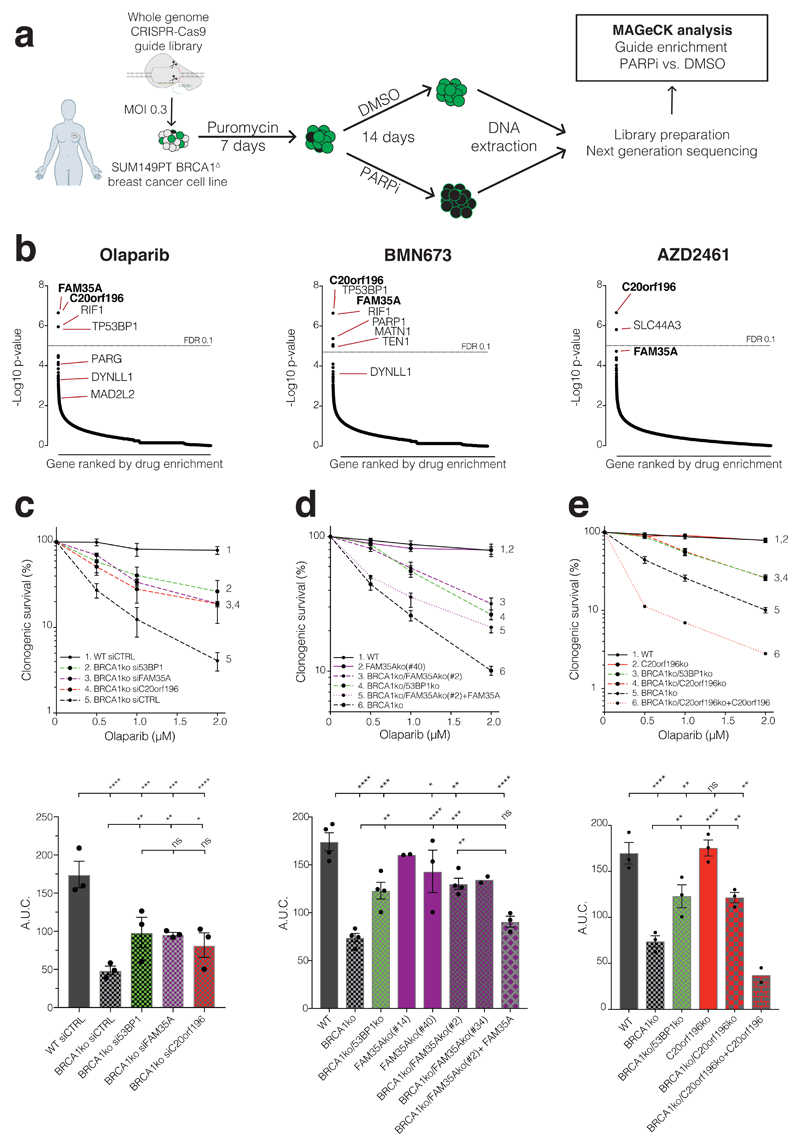
a, Schematic of screen procedure. b, MAGeCK analysis of guide enrichments following specified drug treatments; false discovery rate (FDR) of 0.1 indicated by dotted line; n=3 technical replicates per drug treatment. c, siRNA mediated verification of hits in clonogenic survival assays; lower panels show area under the curve (AUC); n=3 independent experiments d, De novo Cas9 mediated knockout (ko) verification and complementation for FAM35A in clonogenic survival assays (multiple ko clones are shown in AUC); n=4 independent experiments except FAM35Ako(#14) (n=2), FAM35Ako(#40) (n=3), BRCA1ko/FAM35Ako(#34) (n=2), and BRCA1ko/FAM35Ako(#2) +FAM35A (n=3). e, As (d) but for
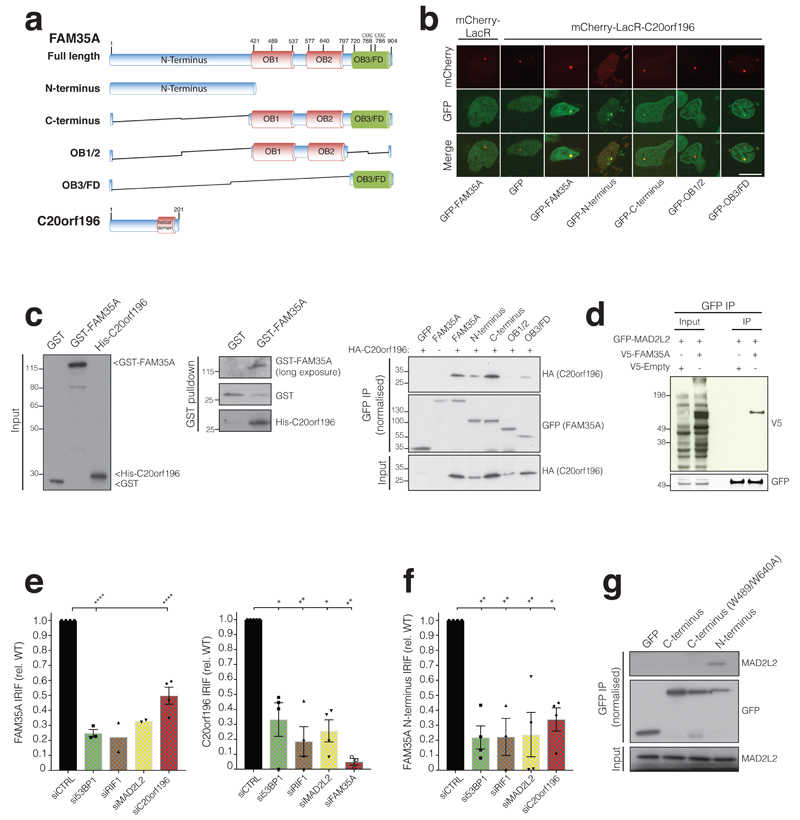
a, FAM35A and
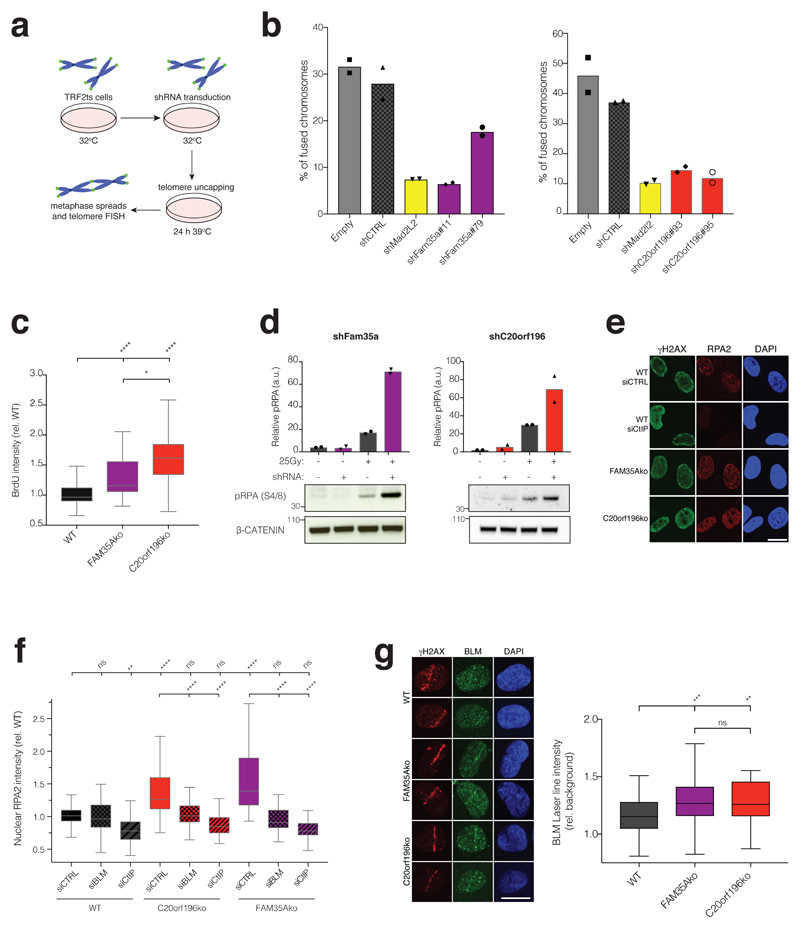
a, Schematic of TRF2ts experimental setup. b, shRNA depletion of FAM35A (left panel) or
Not For Human Consumption!
Inquiry
- Reviews (0)
- Q&As (0)


Ask a Question for All C20orf196 Products
Required fields are marked with *
My Review for All C20orf196 Products
Required fields are marked with *