
Recombinant (cAMP free) Protein Kinase A regulatory subunit-I A
| Cat.No. : | rcfPKArIa-09 |
| Product Overview : | PKA regulatory subunit I a Recombinant is a dimeric 90 kDa protein. PKAR-I alpha is purified by proprietary chromatographic techniques. |
- Specification
- Gene Information
- Related Products
- Citation
- Download
| Source : | E.coli |
| Tag : | Non |
| Description : | The Regulatory (R) subunit of Protein Kinase A (PKA) inhibits its kinase activity by shielding the Catalytic (C) subunit from physiological substrates. This inhibition is reversed in response to extra-cellular signals that increase cAMP levels in the cytoplasm. Upon cAMP binding to R, C is allosterically released from R, activating a spectrum of downstream signaling cascades. Crystallographic data indicated that a series of distinct conformational changes within CBD-A must occur to relay the cAMP signal from the cAMP binding site to the R:C interaction interface. One critical cAMP relay site within the CBD-A of R has been identified as Asp170 because the D170A mutation selectively reduces the negative cooperativity between the cAMP- and C-recognition sites (i.e. the KD for the R:C complex in the presence of cAMP is reduced by more than 12-fold), without significantly compromising the high affinity of R for both binding partners. |
| Physical Appearance : | Sterile Filtered clear solution (0.185mg/ml). |
| Purity : | Greater than 95% as determined by SDS-PAGE. |
| Formulation : | PKA regulatory subunit-I alpha is supplied in 50% glycerol. |
| Unit Definition : | One unit is defined as the amount of recombinant PKA catalytic subunit alpha, required to incorporate 1nmol of phosphate into the specific substrate peptide kemptide (LRRASlG) in one minute at 30°C. |
| Biological Activity : | PKA regulatory subunit alpha specifically inhibits PKA catalytic subunit (Ki about 0.1nM). Activity can be restored by adding cAMP (Kact about 100nM). The binding of the catalytic subunit is dependent on the presence of ATP and Mg. |
| Storage : | PKAR-Ia should be stored at 4°C if entire vial will be used within 2-4 weeks. For long term storage it is recommended to store at -20°C. Avoid multiple freeze-thaw cycles. |
| Synonyms | Protein Kinase A regulatory subunit-I A; cAMP free Protein Kinase A regulatory subunit-I A; PKAR-I alpha; Regulatory (R) subunit of Protein Kinase A (PKA); PRKAR1A; CAR; CNC; CNC1; DKFZp779L0468; MGC17251; PKR1; PRKAR1; TSE1; PPNAD1; Tissue-specific extinguisher 1; cAMP-dependent protein kinase regulatory subunit RIalpha; cAMP-dependent protein kinase type I-alpha regulatory chain; cAMP-dependent protein kinase, regulatory subunit alpha 1; protein kinase A type 1a regulatory subunit; protein kinase, cAMP-dependent, regulatory, type I, alpha (tissue specific extinguisher 1); tissue-specific extinguisher 1. |
Crystal structure of diamondback moth ryanodine receptor Repeat34 domain reveals insect-specific phosphorylation sites
Journal: BMC Biology PubMed ID: 31597572 Data: 2019/10/9
Authors: Tong Xu, Zhiguang Yuchi
Article Snippet:Phosphorylation reactions were performed at 30 °C or 18 °C overnight in 50-μl volumes.Phosphorylation reactions were performed at 30 °C or 18 °C overnight in 50-μl volumes.. The reaction mixture for PKA contained 10 mM HEPES (pH 7.4), 50 mM KCl, 20 mM MgCl 2 , 0.2 mM ATP, 2 mM 2-mercaptoethanol, 0.8 mg/ml DBM RyR Repeat34, and 200 U PKA (Creative BioMart).. The unit of PKA is defined as the amount of enzyme required to incorporate 1 pmol of phosphate into casein in 1 min. DBM PKA and human PKA share a relatively high sequence identity and a conserved activity center, so we chose to use the commercial human PKA for this assay.The unit of PKA is defined as the amount of enzyme required to incorporate 1 pmol of phosphate into casein in 1 min. DBM PKA and human PKA share a relatively high sequence identity and a conserved activity center, so we chose to use the commercial human PKA for this assay.
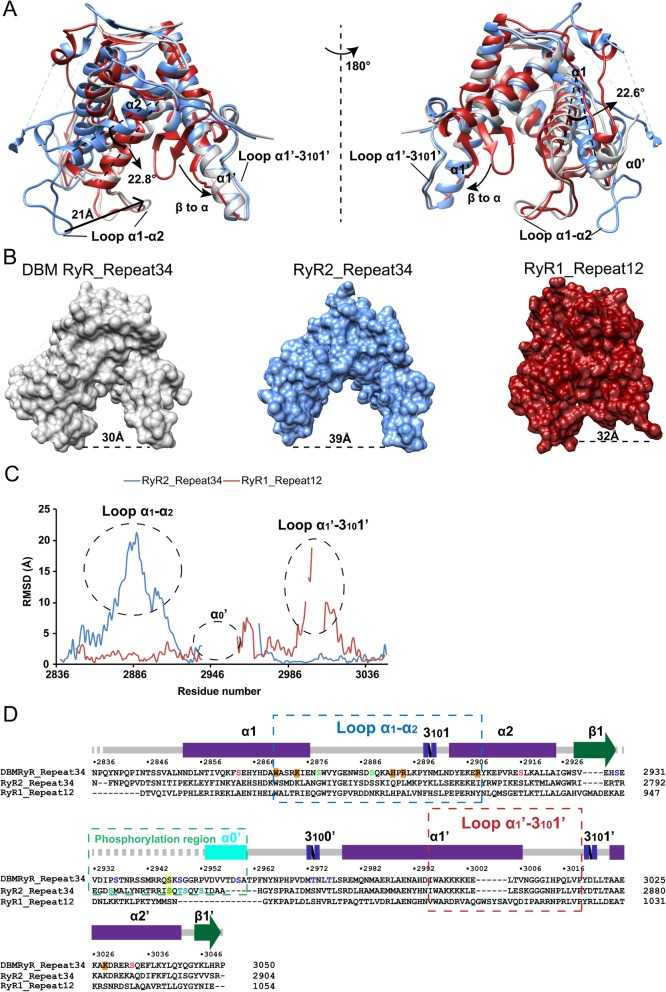
Comparison of repeat domains. a Superpositions of
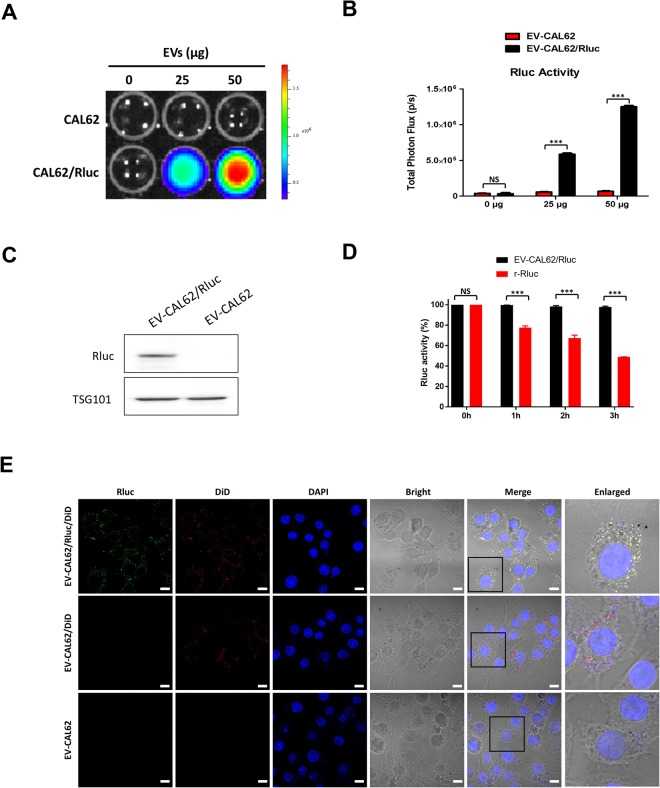
New Optical Imaging Reporter-labeled Anaplastic Thyroid Cancer-Derived Extracellular Vesicles as a Platform for In Vivo Tumor Targeting in a Mouse Model
Journal: Scientific Reports PubMed ID: 30201988 Data: 2018/9/10
Authors: Prakash Gangadaran, Xiu Juan Li, Byeong-Cheol Ahn
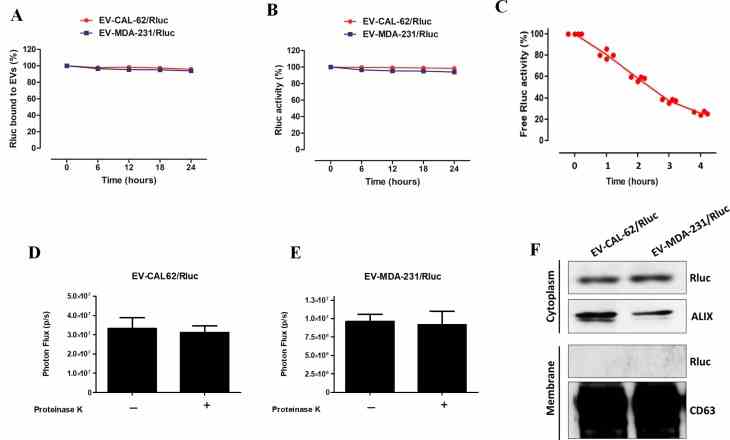
Article Snippet:Stability of Free Rluc protein (Creative BioMart) was evaluated by measuring Rluc activity at 0, 1, 2 and 3 hours.. The appropriate substrate coelenterazine was added to each well.The appropriate substrate coelenterazine was added to each well.
A new bioluminescent reporter system to study the biodistribution of systematically injected tumor-derived bioluminescent extracellular vesicles in mice
Journal: Oncotarget PubMed ID: 29299117 Data: 2017/12/15
Authors: Prakash Gangadaran, Xiu Juan Li, Byeong-Cheol Ahn
Article Snippet:Stability of Free Rluc protein (Creative BioMart) was evaluated by measuring Rluc activity at 0, 1, 2, 3, 4 and 5 hours.. The appropriate substrate coelenterazine was added to each well.The appropriate substrate coelenterazine was added to each well.
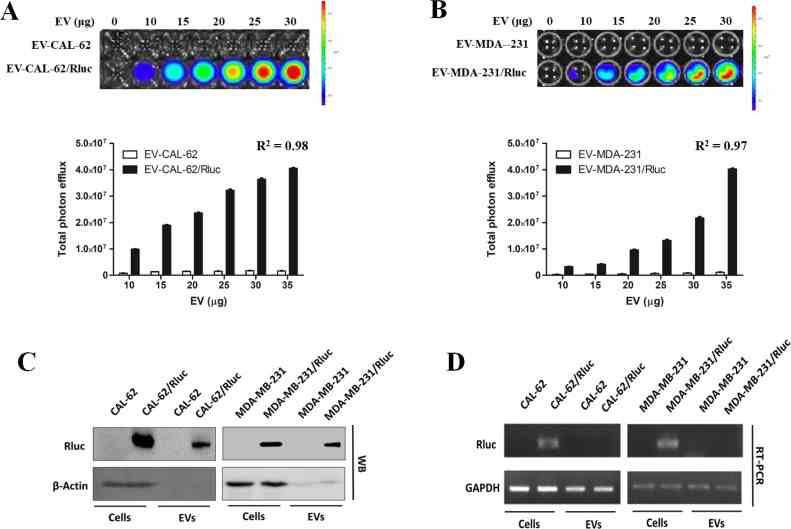
( A , B ) Representative bioluminescent imaging of an in vitro luciferase assay in EVs from CAL-62,
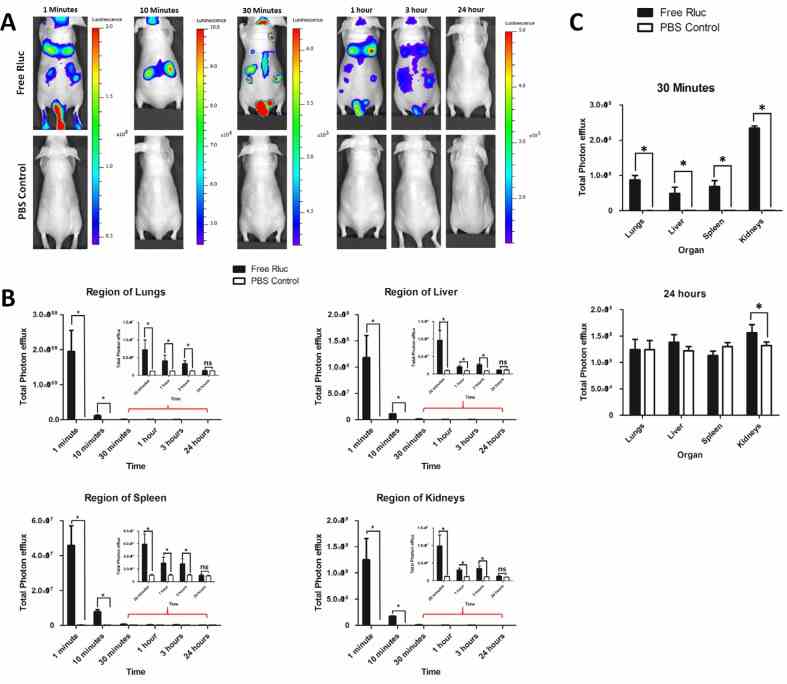
( A ) Representative in vivo bioluminescent imaging (BLI) of mice injected with
Not For Human Consumption!
Inquiry
- Reviews (0)
- Q&As (0)


Ask a Question for All rcfPKAr-Ia Products
Required fields are marked with *
My Review for All rcfPKAr-Ia Products
Required fields are marked with *