
Recombinant RNase H protein
| Cat.No. : | RNASEH1-433H |
| Product Overview : | Recombinant RNase H was expressed in E. coli. |
- Specification
- Gene Information
- Related Products
- Citation
- Download
| Source : | E.coli |
| Tag : | Non |
| Description : | Ribonuclease H (RNase H) is an RNA-specific endonuclease that hydrolyzes single-stranded RNA via a magnesium or manganese cofactor. As such, RNase H is often used to remove the RNA template following reverse transcription or cDNA generation. |
| Form : | Ribonuclease H (RNase H) is supplied in a buffer of 25 mM Tris-HCl (pH 7.5), 30 mM NaCl, 0.5 mM EDTA, 1 mM DTT and 50% glycerol. |
| Unit Definition : | One unit is defined as the amount of enzyme required to produce 1 nmol of acid-soluble product in 20 minutes at 30°C and pH 7.7 using poly(rA)-poly(dT) as a substrate. |
| Applications : | Removal of RNA template following second-strand cDNA synthesis;Removal of mRNA poly(A) sequence;Reverse transcription; |
| Storage : | Store at -20 centigrade |
| Concentration : | 20–60 U/µL |
| Publications : |
Characterization of Escherichia coli RNase H Discrimination of DNA Phosphorothioate Stereoisomers (2021)
|
| ◆ Recombinant Proteins | ||
| RNASEH1-433H | Recombinant RNase H protein | +Inquiry |
| RNase H-24 | Thermostable Active Recombinant RNase H | +Inquiry |
RNase H sequence preferences influence antisense oligonucleotide efficiency
Journal: Nucleic Acids Research PubMed ID: 29126318 Data: 2017/12/15
Authors: ?ukasz J. Kie?piński, Peter H. Hagedorn, Jeppe Vinther
Article Snippet:Hydrolysis reactions with recombinant human RNase H1 (Creative BioMart cat. RNASEH1-433H) were performed at 37°C in a buffer RNH1 (20 mM Tris–HCl pH 7.5, 20 mM KCl, 20 mM 2-mercaptoethanol, 2 mM MgCl 2 and 0.1 mM EDTA (modified from Lima et al. , 2001 ( )).. Preheated solution containing 0.3 pmol of prepared duplex in 16.5 μl was mixed with preheated 16.5 μl of 0.5 mU/μl RNase H1 dilution to initiate the hydrolysis reaction to give a final enzyme concentration of 0.25 mU/μl.Preheated solution containing 0.3 pmol of prepared duplex in 16.5 μl was mixed with preheated 16.5 μl of 0.5 mU/μl RNase H1 dilution to initiate the hydrolysis reaction to give a final enzyme concentration of 0.25 mU/μl.
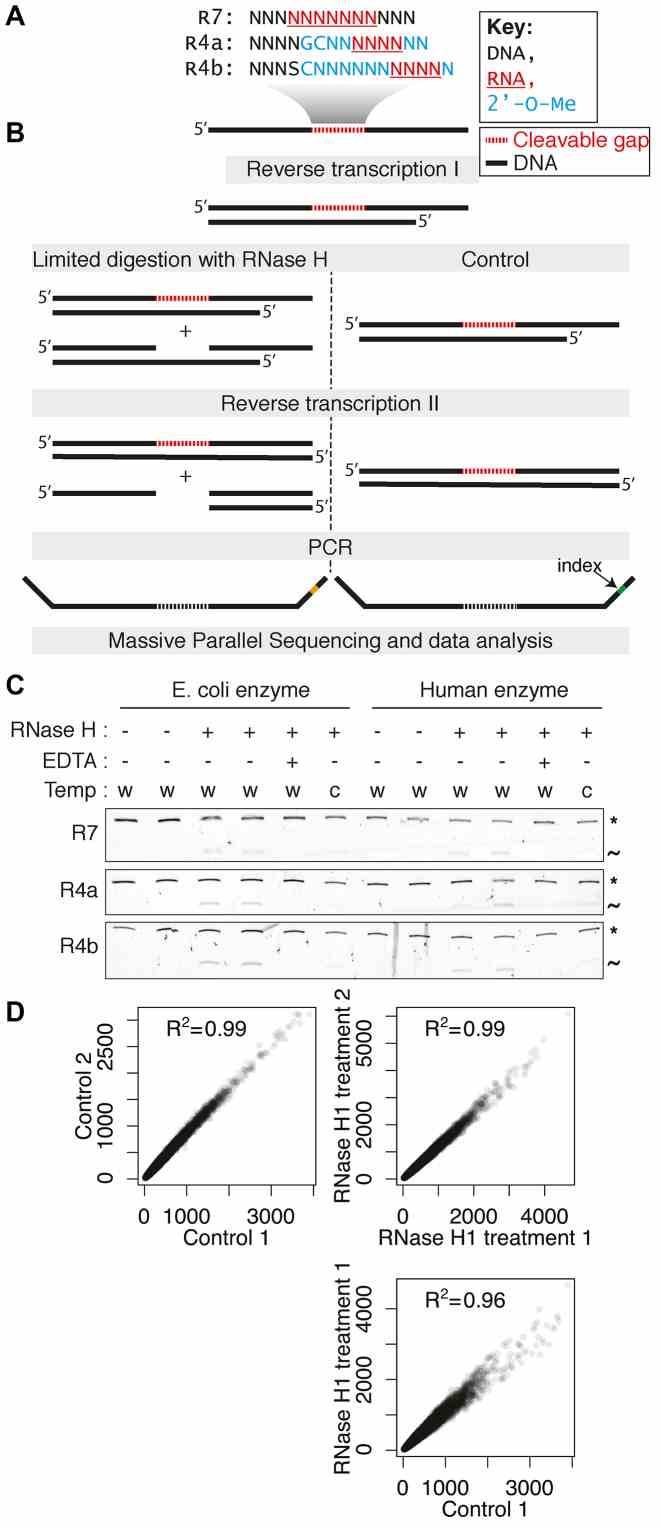
Overview and validation of the H-SPA method. ( A ) Sequences of the cleavable randomized gaps used in this study. ( B ) Schematic representation of the experimental strategy. ( C ) Denaturing gel electrophoresis showing the limited digestion of double stranded substrates. The uncleaved duplexes are indicated with the asterisk and the cleaved fragment with the tilde. The reaction conditions are indicated: w: 37°C; c: 16°C and EDTA: 0.1 mM. ( D ) Correlation of heptamer counts for the construct R4b (positions 9–15) between two untreated controls (top left), two human
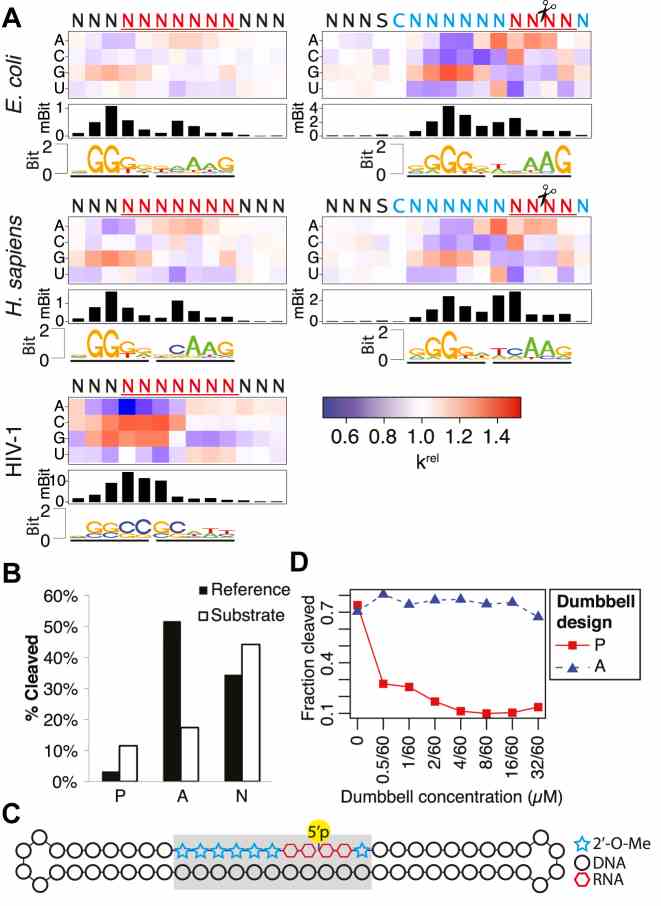
Sequence preferences of Escherichia coli, Homo sapiens and HIV-1
![RNase H Sequence Preferences correlate with gapmer efficiency. ( A ) Correlation between the log 2 fold changes of different hexamers observed for the R4b construct in the experiment and the corresponding log 2 fold changes as predicted by a single nucleotide model prepared from the data obtained in the R4a experiment. ( B ) As in (A), but with prediction with a dinucleotide model. ( C ) Prediction of RNase H1 mediated downregulation of the different 11-mers present in RNA sequence used for the RNase H RNA–DNA heteroduplex crystal structure [PDB: 2QK9]. Each bar corresponds to the cleavage site of a potential binding mode of RNase H1. The filled bar corresponds to the RNase H1 binding mode observed in the crystal structure and is also indicated in the drawing below the plot. ( D ) Correlation between the change of target RNA level for MAPT after treatment with 1518 different gapmers and the corresponding downregulation predicted by the dinucleotide model for the different binding modes of RNase H1 on each gapmer target duplex. The error bars show the 99% confidence intervals. The drawing below the plot indicates the RNase H1 binding mode associated with the best-observed correlation. ( E ) The same analysis as in (D), but with 1581 different gapmers targeted against ANGPTL3 .](productimages/extendimages/pmc05728404__gkx1073fig3.jpg)
Not For Human Consumption!
Inquiry
- Reviews (0)
- Q&As (0)


Ask a Question for All RNase H Products
Required fields are marked with *
My Review for All RNase H Products
Required fields are marked with *