


Recombinant Human CFTR
| Cat.No. : | CFTR-27241TH |
| Product Overview : | Recombinant fragment of Human CFTR (amino acids 1381-1480) with N terminal proprietary tag, 36.63kDa. |
- Specification
- Gene Information
- Related Products
- Citation
- Download
| Species : | Human |
| Source : | Wheat Germ |
| Tag : | Non |
| Protein Length : | 100 amino acids |
| Description : | This gene encodes a member of the ATP-binding cassette (ABC) transporter superfamily. ABC proteins transport various molecules across extra- and intra-cellular membranes. ABC genes are divided into seven distinct subfamilies (ABC1, MDR/TAP, MRP, ALD, OABP, GCN20, White). This protein is a member of the MRP subfamily that is involved in multi-drug resistance. The encoded protein functions as a chloride channel and controls the regulation of other transport pathways. Mutations in this gene are associated with the autosomal recessive disorders cystic fibrosis and congenital bilateral aplasia of the vas deferens. Alternatively spliced transcript variants have been described, many of which result from mutations in this gene. |
| Molecular Weight : | 36.630kDa inclusive of tags |
| Tissue specificity : | Found on the surface of the epithelial cells that line the lungs and other organs. |
| Form : | Liquid |
| Purity : | Proprietary Purification |
| Storage buffer : | pH: 8.00Constituents:0.3% Glutathione, 0.79% Tris HCl |
| Storage : | Shipped on dry ice. Upon delivery aliquot and store at -80oC. Avoid freeze / thaw cycles. |
| Sequences of amino acids : | YQIIRRTLKQAFADCTVILCEHRIEAMLECQQFLVIEENKVRQYDSIQKLLNERSLFRQAISPSDRVKLFPHRNSSKCKSKPQIAALKEETEEEVQDTRL |
| Sequence Similarities : | Belongs to the ABC transporter superfamily. ABCC family. CFTR transporter (TC 3.A.1.202) subfamily.Contains 2 ABC transmembrane type-1 domains.Contains 2 ABC transporter domains. |
| Gene Name | CFTR cystic fibrosis transmembrane conductance regulator (ATP-binding cassette sub-family C, member 7) [ Homo sapiens ] |
| Official Symbol | CFTR |
| Synonyms | CFTR; cystic fibrosis transmembrane conductance regulator (ATP-binding cassette sub-family C, member 7); ABCC7, CF, cystic fibrosis transmembrane conductance regulator, ATP binding cassette (sub family C, member 7); cystic fibrosis transmembrane conducta |
| Gene ID | 1080 |
| mRNA Refseq | NM_000492 |
| Protein Refseq | NP_000483 |
| MIM | 602421 |
| Uniprot ID | P13569 |
| Chromosome Location | 7q31-q32 |
| Pathway | ABC transporters, organism-specific biosystem; ABC transporters, conserved biosystem; ABC-family proteins mediated transport, organism-specific biosystem; Bile secretion, organism-specific biosystem; Bile secretion, conserved biosystem; |
| Function | ATP binding; ATP-binding and phosphorylation-dependent chloride channel activity; ATPase activity; PDZ domain binding; channel-conductance-controlling ATPase activity; |
| ◆ Recombinant Proteins | ||
| CFTR-1187HFL | Recombinant Human CFTR protein, His&Flag-tagged | +Inquiry |
| CFTR-1616M | Recombinant Mouse CFTR Protein, His (Fc)-Avi-tagged | +Inquiry |
| CFTR-830R | Recombinant Rhesus monkey CFTR Protein, His-tagged | +Inquiry |
| CFTR-1357R | Recombinant Rat CFTR Protein | +Inquiry |
| CFTR-274H | Recombinant Human CFTR protein, His-tagged | +Inquiry |
Cystic fibrosis transmembrane conductance regulator attaches tumor suppressor PTEN to the membrane and promotes anti Pseudomonas aeruginosa immunity
Journal: Immunity PubMed ID: 29246444 Data: 2018/12/19
Authors: Sebastián A. Riquelme, Benjamin D. Hopkins, Alice Prince
Article Snippet:Chemicals, Peptides, and Recombinant Proteins , , .Chemicals, Peptides, and Recombinant Proteins , , .. Recombinant Human CFTR (1381-1480), GST-tagged , Creative-BioMart , Cat# CFTR-275H Lot # 101018.. Recombinant Human CFTR (1381-1480), GST-tagged , Abnova , Cat# H00001080-Q01 Lot # G7151.Recombinant Human CFTR (1381-1480), GST-tagged , Abnova , Cat# H00001080-Q01 Lot # G7151.
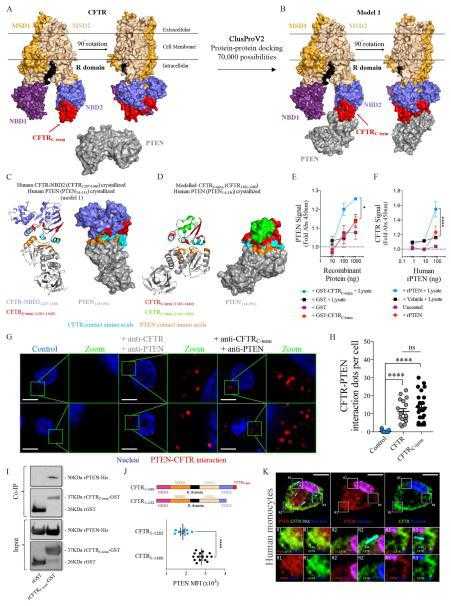
(A) Frontal and Lateral (left) view of the crystallized non-phosphorylated human
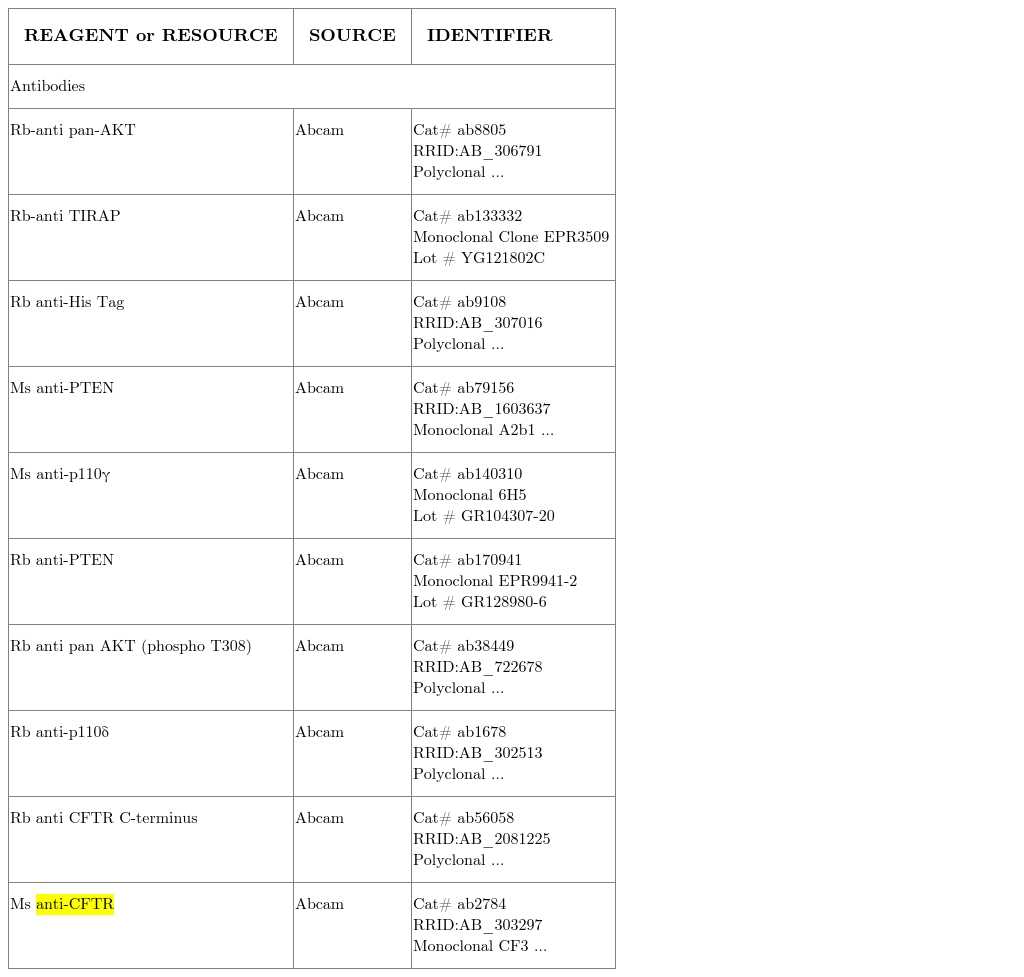
KEY RESOURCES TABLE
Not For Human Consumption!
Inquiry
- Reviews (0)
- Q&As (0)


Ask a Question for All CFTR Products
Required fields are marked with *
My Review for All CFTR Products
Required fields are marked with *