


Recombinant Human Phosphoserine Aminotransferase 1, His-tagged
| Cat.No. : | PSAT1-1328H |
| Product Overview : | Recombinant human PSAT1 protein, fused to His-tag at N-terminus, was expressed in E.coli and purified by using conventional chromatography. |
- Specification
- Gene Information
- Related Products
- Citation
- Download
| Species : | Human |
| Source : | E.coli |
| Tag : | His |
| Protein Length : | 1-370 a.a. |
| Description : | PSAT1, also known as phosphoserine aminotransferase, catalyses the conversion of 3-phosphohydroxypyruvate into 3-phosphoserine which is dephosphorylated subsequently by phosphoserine phosphatase to form L-serine. |
| Form : | Liquid. In 20 mM Tris-HCl buffer (pH 8.0) containing 1 mM DTT, 20% glycerol. |
| Molecular Weight : | 42.9 kDa (394 aa), confirmed by MALDI-TOF |
| Purity : | > 90 % by SDS-PAGE |
| Concentration : | 1 mg/ml (determined by Bradford) |
| Sequences of amino acids : | MGSSHHHHHH SSGLVPRGSH MGSHMDAPRQ VVNFGPGPAK LPHSVLLEIQ KELLDYKGVG ISVLEMSHRS SDFAKIINNT ENLVRELLAV PDNYKVIFLQ GGGCGQFSAV PLNLIGLKAG RCADYVVTGA WSAKAAEEAK KFGTINIVHP KLGSYTKIPD PSTWNLNPDA SYVYYCANET VHGVEFDFIP DVKGAVLVCD MSSNFLSKPV DVSKFGVIFA GAQKNVGSAG VTVVIVRDDL LGFALRECPS VLEYKVQAGN SSLYNTPPCF SIYVMGLVLE WIKNNGGAAA MEKLSSIKSQ TIYEIIDNSQ GFYVCPVEPQ NRSKMNIPFR IGNAKGDDAL EKRFLDKALE LNMLSLKGHR SVGGIRASLY NAVTIEDVQK LAAFMKKFLE MHQL |
| Storage : | Can be stored at +4°C short term (1-2 weeks). For long term storage, aliquot and store at -20°C or -70°C. Avoid repeated freezing and thawing cycles. |
| Pathways : | Glycine, serine and threonine metabolism; Metabolic pathways; Vitamin B6 metabolism; Serine biosynthesis |
| Gene Name | PSAT1 phosphoserine aminotransferase 1 [ Homo sapiens ] |
| Official Symbol | PSAT1 |
| Synonyms | PSAT1; phosphoserine aminotransferase 1; PSA; EPIP; PSAT; MGC1460; endometrial progesterone-induced protein; EC 2.6.1.52 |
| Gene ID | 29968 |
| mRNA Refseq | NM_021154 |
| Protein Refseq | NP_066977 |
| MIM | 610936 |
| UniProt ID | Q9Y617 |
| Chromosome Location | 9q21.2 |
| Function | O-phospho-L-serine:2-oxoglutarate minotransferase activity; pyridoxal phosphate binding; transferase activity |
| ◆ Recombinant Proteins | ||
| PSAT1-1198HFL | Recombinant Full Length Human PSAT1 Protein, C-Flag-tagged | +Inquiry |
| PSAT1-1560H | Recombinant Human PSAT1, T7-tagged | +Inquiry |
| Psat1-325M | Recombinant Mouse Psat1 Protein, MYC/DDK-tagged | +Inquiry |
| PSAT1-0271H | Recombinant Human PSAT1 Protein (L17-L370), His tagged | +Inquiry |
| PSAT1-11139Z | Recombinant Zebrafish PSAT1 | +Inquiry |
| ◆ Cell & Tissue Lysates | ||
| PSAT1-1424HCL | Recombinant Human PSAT1 cell lysate | +Inquiry |
The breast cancer oncogene IKKε coordinates mitochondrial function and serine metabolism
Journal: bioRxiv Data: 2019/11/26
Authors: Xu Ruoyan, Jones William, Bianchi Katiuscia
Article Snippet:PrePrint: HA-tagged IKKε was isolated and purified from 1mg of whole cell lysate by pull-down using Anti-HA Agarose beads (Sigma Aldrich) for 1hr at 4°C with continuous mixing.HA-tagged IKKε was isolated and purified from 1mg of whole cell lysate by pull-down using Anti-HA Agarose beads (Sigma Aldrich) for 1hr at 4°C with continuous mixing.. 5 pmol of purified recombinant PSAT1 protein (PSAT1-1328H, Creative BioMart) was added to the pelleted and washed agarose beads along with kinase buffer (25mM Tris HCl (pH 7.8), 10mM MgCl 2 , 0.5 mM EGTA, 1mM DTT, 1mM Na 3 VO 4 , 2.5mM Na 2 P 2 H 2 O 7 and 20mM β-glycerol phosphate) and 10mM ATP (New England Biolabs) to a total volume of 50μl.. The reaction was incubated at room temperature for 20 minutes and halted by the addition of solid urea to a final concentration of 8M.The reaction was incubated at room temperature for 20 minutes and halted by the addition of solid urea to a final concentration of 8M.
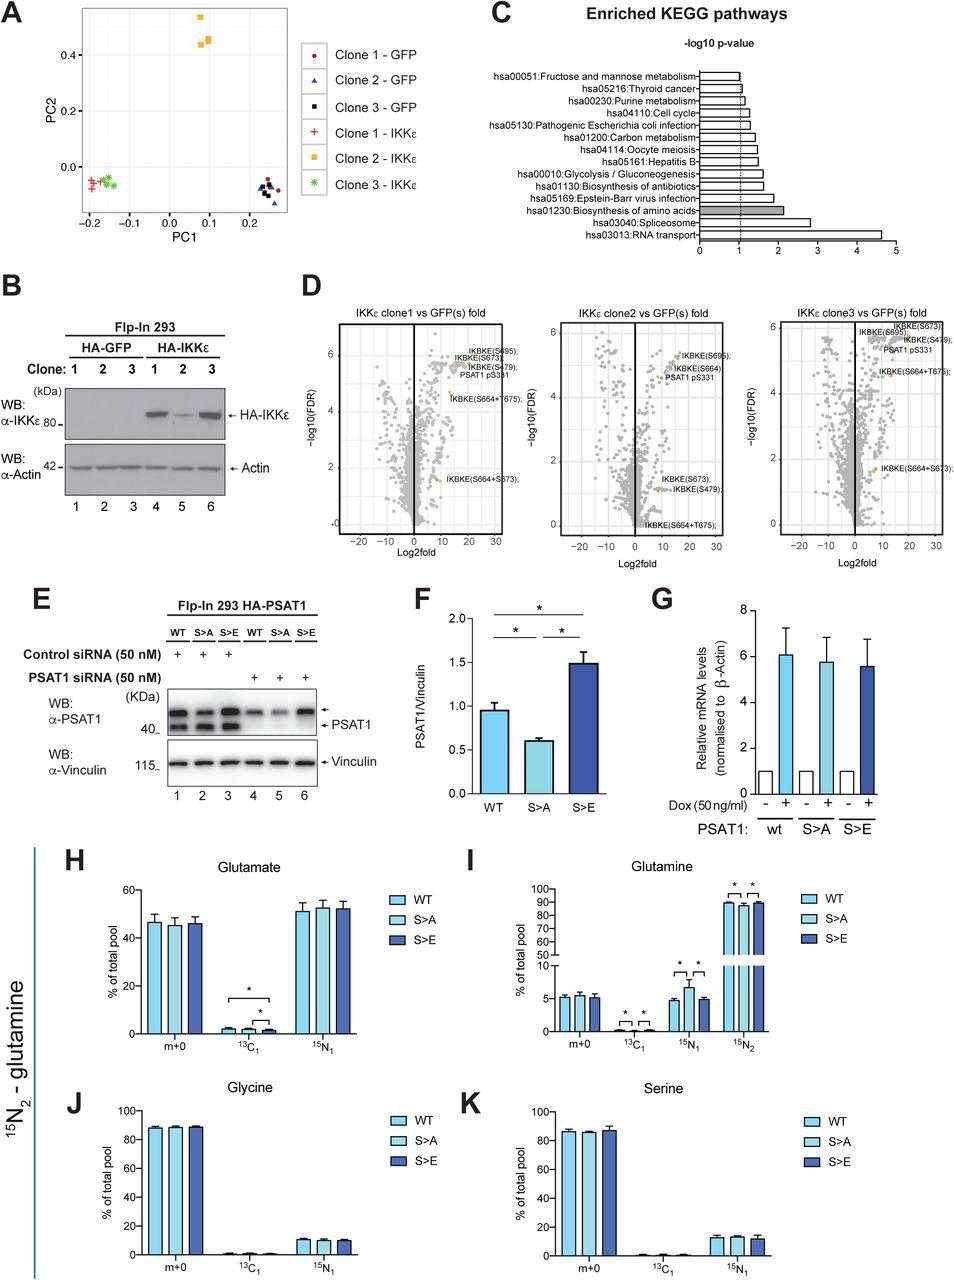
(A) Principal component analysis of differentially phosphorylated substrates in three independent single cell clones of Flp-In 293 HA-GFP or Flp-In 293 HA-IKKε cells treated with doxycycline (100 ng/ml, 16 hours). The phosphoproteomes in the three clones were analysed by mass spectrometry as described in material and methods. (B) Level of IKKε in three independent single cell clones of Flp-In 293 HA-GFP or Flp-In 293 HA-IKKε cells following treatment with doxycycline (100 ng/ml, 16 hours). (C) Pathway enrichment analysis of phosphoproteomic data identifying modification of proteins in key metabolic and signalling pathways as a result of IKKε expression. Enriched pathways from differentially phosphorylated substrates were determined using the David pathway enrichment analysis tool (see material and methods). (D) Volcano plot representation of statistically significant differentially phosphorylated substrates in indicated Flp-In 293 HA-IKKε expressing clones relative to HA-GFP expressing controls (n=4 independent replicates). P values were calculated by unpaired Student’s t-test of log transformed normalised phosphopeptide intensity values (peak areas of extracted ion chromatograms). Highlighted dots represent IKKε auto-phosphorylation sites indicative of kinase activity, and
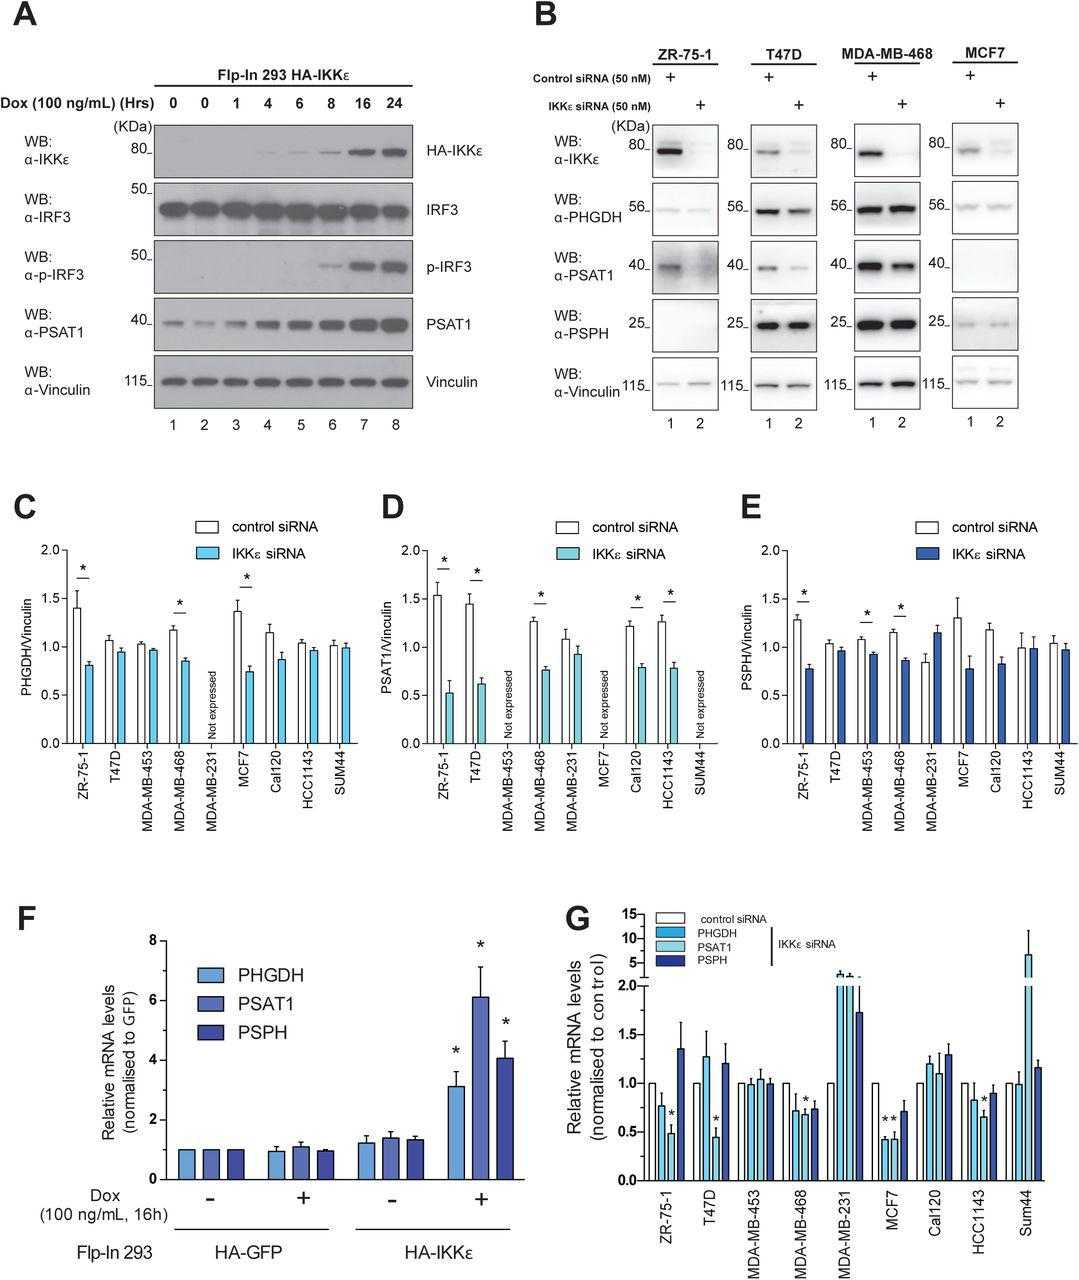
(A) Levels of IKKε, IRF3, phosphorylated IRF3 (S396) and
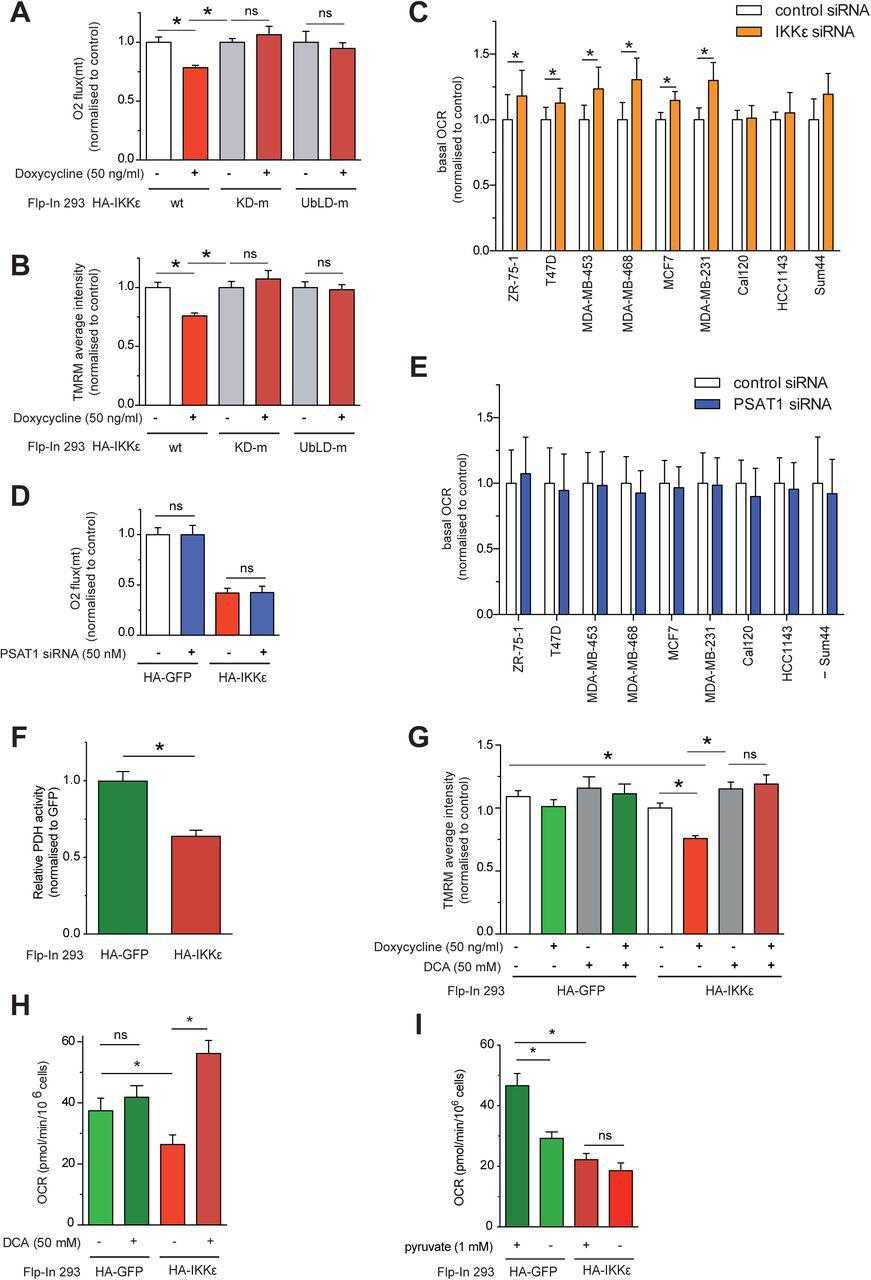
(A) Basal oxygen consumption in Flp-In 293 HA-IKKε wt, Flp-In 293 HA-IKKε KD-m and Flp-In 293 HA-IKKε UbLD-m cells following treatment with doxycycline (16 hours), measured using Oroboros high resolution respirometry. Data are normalised to non-treated control cells. (B) Average TMRM staining intensity in Flp-In 293 HA-IKKε wt, Flp-In 293 HA-IKKε KD-m and Flp-In 293 HA-IKKε UbLD-m expressing cells induced by doxycycline (16 hours). Data are normalised to non-treated controls cells. (C) Basal mitochondrial oxygen consumption rate (OCR) in a panel of IKBKE -silenced breast cancer cell lines, transfected with a pool of 4 targeting siRNA oligos, measured using Seahorse XF96 analysis (n ≥ 3, mean ± SEM, *p < 0.05, paired). (D) Basal oxygen consumption in
Not For Human Consumption!
Inquiry
- Reviews (0)
- Q&As (0)


Ask a Question for All PSAT1 Products
Required fields are marked with *
My Review for All PSAT1 Products
Required fields are marked with *