


Recombinant Human Tubulin, Beta, GST-tagged
| Cat.No. : | TUBB-1501H |
| Product Overview : | Recombinant full-length human TUBB1 was expressed inE. colicells using an N-terminal GST tag. MW = 76 kDa. |
- Specification
- Gene Information
- Related Products
- Citation
- Download
| Species : | Human |
| Source : | E.coli |
| Tag : | GST |
| Description : | TUBB1 or tubulin-beta 1 protein is a major constituent of microtubules. TUBB1 interaction with microtubule-associated proteins (MAPs) such as tau is fundamental for microtubule structure and function. Previous work suggested that the "microtubule binding domain" of tau (composed of three or four imperfect 18-amino acid repeats, separated by 13- or 14-amino acid inter-repeat regions) can bind to the C-terminal ends of both alpha and beta tubulin monomers. Studies revealed that TUBB1 is the target of various antitubulin agents used in the treatment of cancer. Subsequent studies have also concluded that TUBB1 mutations in clinical samples are rare, and unlikely to contribute to drug resistance. |
| Sequence : | Full-length. |
| Applications : | Kinase Assay, Western Blot. |
| Storage And Stability : | Store product at -70℃. For optimal storage, aliquot target into smaller quantities after centrifugation and store at recommended temperature. For most favorable performance, avoid repeated handling and multiple freeze/thaw cycles. |
| Gene Name | TUBB tubulin, beta [ Homo sapiens ] |
| Synonyms | TUBB; tubulin, beta; TUBB5; TUBB1; M40; MGC117247; MGC16435; OK/SW-cl.56; TUBB; beta 5-tubulin; beta-4 tubulin; beta Ib tubulin; OTTHUMP00000029069; tubulin beta-1 chain; tubulin beta-5 chain; tubulin beta polypeptide; tubulin, beta polypeptide; OTTHUMP00000029069; Tubb5; Tubulin beta-5 chain |
| Gene ID | 203068 |
| mRNA Refseq | NM_178014 |
| Protein Refseq | NP_821133 |
| MIM | 191130 |
| UniProt ID | P07437 |
| Chromosome Location | 6p21.33 |
| Pathway | Gap junction; Pathogenic Escherichia coli infection – EHEC; Pathogenic Escherichia coli infection – EPEC; Cell Cycle, Mitotic |
| Function | GTP binding; GTPase activity; MHC class I protein binding; nucleotide binding; structural constituent of cytoskeleton |
| ◆ Recombinant Proteins | ||
| TUBB-1501H | Recombinant Human Tubulin, Beta, GST-tagged | +Inquiry |
| TUBB-5388R | Recombinant Rhesus macaque TUBB protein | +Inquiry |
| TUBB-5387R | Recombinant Rhesus macaque TUBB protein | +Inquiry |
| TUBB-4838R | Recombinant Rhesus Macaque TUBB Protein, His (Fc)-Avi-tagged | +Inquiry |
| TUBB-1899H | Recombinant Human TUBB protein, His & T7-tagged | +Inquiry |
| ◆ Cell & Tissue Lysates | ||
| TUBB-653HCL | Recombinant Human TUBB 293 Cell Lysate | +Inquiry |
Direct interaction of metastasis-inducing S100P protein with tubulin causes enhanced cell migration without changes in cell adhesion
Journal: Biochemical Journal PubMed ID: 32065231 Data: 2020/3/27
Authors: Min Du, Guozheng Wang, Philip S. Rudland
Article Snippet:For Western blotting, S100P was detected using mouse anti-S100P monoclonal antibody (mAb) (1 : 50 dilution) (BD Biosciences) which showed no cross-reaction with S100A1, A2 or A4 proteins [ ].For Western blotting, S100P was detected using mouse anti-S100P monoclonal antibody (mAb) (1 : 50 dilution) (BD Biosciences) which showed no cross-reaction with S100A1, A2 or A4 proteins [ ].. Anti-tubulin (α, β), anti-actin from Sigma and anti-nonmuscle myosin IIA (NMIIA) from Covance (Princetown, NJ) were used as described previously [ , ]. α-tubulin was synthesised by recombinant means ( and ) ( ) and β-tubulin purchased from Creative BioMart (Shirley, U.S.A.).. For pulldown assays, S100P-inducible COS-7 cells were incubated with doxycycline for 16 h and lysed in 20 mM Tris–HCl pH 8.0, 150 mM NaCl and 1% (v/v) Nonidet P-40 (NP-40) with 0.5 mM CaCl 2 or 1.0 mM EGTANa 2 .For pulldown assays, S100P-inducible COS-7 cells were incubated with doxycycline for 16 h and lysed in 20 mM Tris–HCl pH 8.0, 150 mM NaCl and 1% (v/v) Nonidet P-40 (NP-40) with 0.5 mM CaCl 2 or 1.0 mM EGTANa 2 .
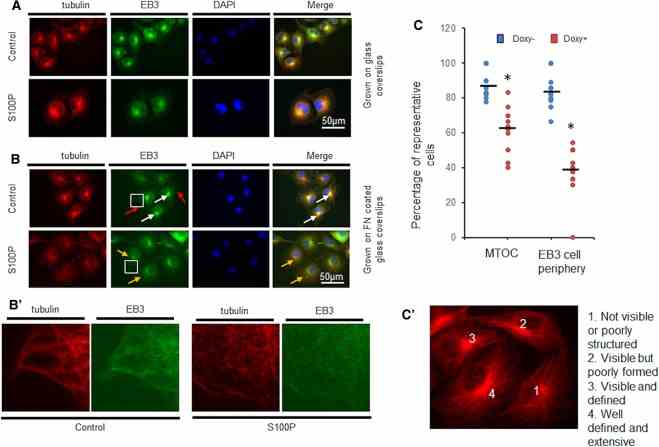
COS-7 S10 cells were induced for 48 h with 1 μg/ml doxycycline (S100P) or left untouched (Control) prior to seeding on ( A ) glass or ( B ) fibronectin (FN)-coated glass coverslips. After a further 48 h incubation in the same but fresh media, cells were dually immunofluorescently stained with TRITC-labelled antibodies to
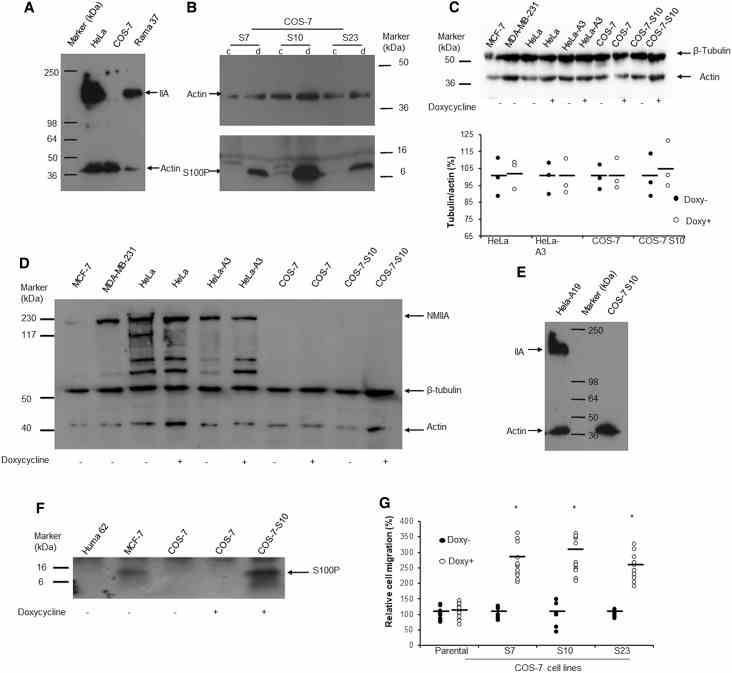
( A ) Western blot with anti-nonmuscle myosin IIA and anti-β-actin. There was no band at 226 kDa corresponding to nonmuscle myosin IIA (IIA) in monkey COS-7 cells compared to that seen in human HeLa and rat Rama 37 cells. The gels have been overexposed to detect even the smallest trace of NMIIA. ( B ) Three clones of S100P-inducible COS-7 cells (S7, S10, S23) were exposed to 0 (c) or 1 μg/ml (d) doxycycline for 24 h. Western blot of equal amounts of loaded proteins shows relative S100P levels. In addition to monomeric S100P at an apparent mol wt of 10 kDa (arrow), multimeric forms can also be seen in these overexposed gels. ( C ) Effects of doxycycline on the abundance of
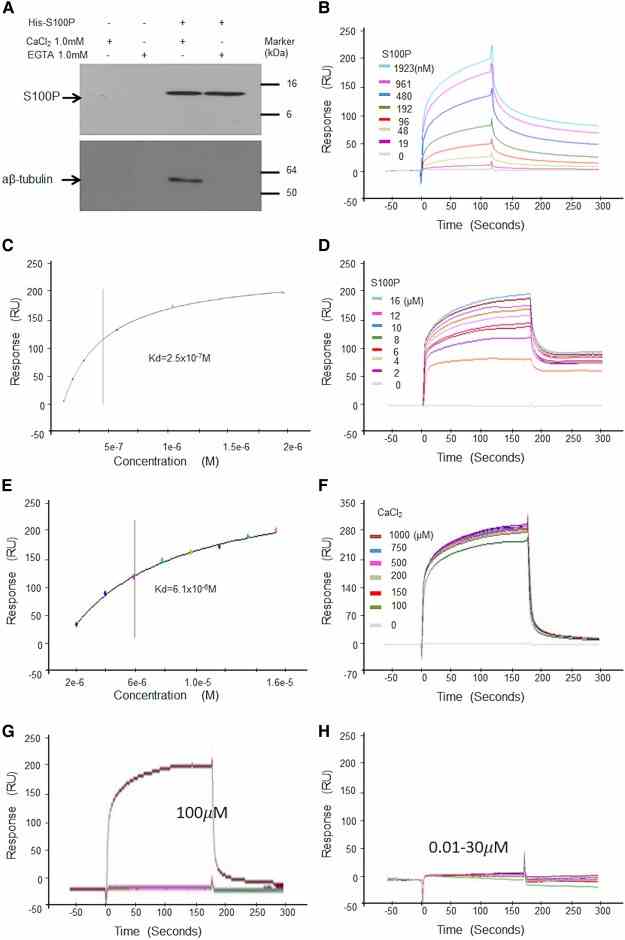
( A ) Pulldown assay. His-S100P was loaded on His-binding beads. COS-7 cell lysates were applied to control beads (His-binding beads only) (a and b) or His-S100P beads (c and d) in the presence of 1 mM CaCl 2 (a and c) or EGTA (b and d). After extensive washings, bound proteins were eluted with 300 mM imidazole from each bead and any His-S100P or α, β-tubulins were detected by Western blotting using anti-S100P (Upper panel) or
Not For Human Consumption!
Inquiry
- Reviews (0)
- Q&As (0)


Ask a Question for All TUBB Products
Required fields are marked with *
My Review for All TUBB Products
Required fields are marked with *