


Membrane Protein Nanoparticles (MNPs) Functional Validation and Quality Control Experimental Manual
1. MNP-Specific Activity Detection Methods
1.1 Ligand Binding Assay: Radioactive and Fluorescent Ligand Binding Protocols
Ligand binding assay is the gold standard for verifying that membrane proteins on MNPs retain their native conformation and functional activity. This experiment quantitatively detects the binding capacity of labeled ligands to target proteins on MNPs, calculates binding capacity (Bmax) and dissociation constant (Kd), thereby evaluating protein activity density and affinity.
Explore MNPs Products
Learn More
Radioactive Ligand Binding Assay
Materials Preparation:
- ¹²⁵I or ³H-labeled specific ligand (specific activity ≥2000 Ci/mmol)
- Unlabeled ligand (for non-specific binding determination)
- MNP sample (protein concentration 0.1-0.5 mg/mL)
- Buffer: PBS (pH 7.4) + 0.1% BSA + 5 mM MgCl₂
- 96-well filter plates (0.22 μm PVDF membrane)
- Liquid scintillation counter
Standard Operating Procedure:
- MNP Pre-equilibration: Dilute MNPs to 50 μg/mL (total protein concentration) and pre-equilibrate in binding buffer for 30 minutes at 4°C.
- Saturation Binding Curve Construction: Set up 12 concentration gradients with radioactive ligand concentration ranging from 0.01-10 nM, final volume of 200 μL per well, MNP usage of 10 μg/well.
- Competition Binding Experiment: Fix radioactive ligand concentration (approximately Kd value), add unlabeled competing ligand (concentration gradient from 10⁻¹² to 10⁻⁵ M).
- Incubation Conditions: Incubate at 4°C for 2-4 hours (to avoid endocytosis) with gentle shaking (50 rpm).
- Separation of Bound/Free Ligand: Vacuum filter through pre-wetted PVDF membrane, quickly wash 3 times with 4°C binding buffer (200 μL each time).
- Radioactivity Detection: Add scintillation fluid to membrane, measure cpm values with liquid scintillation counter, convert to fmol/mg protein after quench correction.
Fluorescent Ligand Binding Assay
Suitable for laboratories without radioactive operation capabilities, employing time-resolved fluorescence (TR-FRET) or fluorescence polarization (FP) technology.
Procedure:
- Fluorescent Ligand Labeling: Use red-shifted dyes (e.g., Alexa Fluor 647 or Cy5) to label ligand, control labeling ratio (DOL) at 1-3.
- Reaction System: Black 96-well plate, MNP final concentration 20-100 μg/mL, fluorescent ligand 0.1-50 nM, total volume 100 μL.
- TR-FRET Detection: Add Eu³⁺ chelate-labeled antibody (e.g., anti-His-tag), incubate at room temperature for 1 hour protected from light.
- Signal Reading: EnVision plate reader, excitation wavelength 340 nm, emission wavelengths 615 nm (Eu) and 665 nm (APC), calculate 665/615 ratio.
- Data Analysis: Fit One-site binding model with GraphPad Prism software to obtain Bmax and Kd values. Acceptance criteria: Kd value difference from native cell membrane <2-fold, Bmax >50 pmol/mg.
Key Quality Control Points:
- Non-specific binding should be <30% of total binding
- Hill coefficient should be between 0.85-1.15
- Z' factor >0.5 ensures experimental reliability
1.2 GPCR Functional Detection: GTPγS Binding Assay (for ADORA2A, CB1, CCRs, TSHR)
The GTPγS binding assay is the core functional test for evaluating G protein-coupled receptor (GPCR) coupling efficiency and activity. When an agonist activates a GPCR, it promotes GTPγS[³⁵S] binding to the Gα subunit, with signal directly proportional to receptor activity.
GPCR Screening Assays Service
Inquiry
Assay-Specific Optimization Protocols:
ADORA2A (Adenosine A2A Receptor) Detection:
- Agonist: NECA (5'-N-ethylcarboxamidoadenosine), concentration gradient 10⁻¹⁰-10⁻⁵ M
- Buffer: HEPES 25 mM, MgCl₂ 10 mM, NaCl 100 mM, GDP 10 μM
- Specificity: Verify specific binding with A2A-selective antagonist ZM241385 (10 nM)
CB1 (Cannabinoid Receptor Type 1) Detection:
- Agonist: CP55,940, concentration gradient 10⁻¹¹-10⁻⁶ M
- Enhancer: Add 0.1% DMSO to improve lipophilic ligand solubility
- Blocking: CB1-specific antagonist AM251 (1 μM) for non-specific signal determination
CCRs (Chemokine Receptors) Detection:
- CCL19 Ligand: For CCR7 detection, concentration gradient 10⁻¹¹-10⁻⁷ M
- Buffer Adjustment: Add 0.5 mM CaCl₂ to maintain receptor conformation
- Time Optimization: Incubate at 37°C for 30 minutes (shorter than other GPCRs)
Explore Chemokine and Chemokine Receptors' Products
Learn More
TSHR (Thyroid-Stimulating Hormone Receptor) Detection:
- Agonist: bTSH (bovine TSH), concentration gradient 10⁻¹²-10⁻⁶ M
- Special Requirement: Pre-activate MNPs (incubate at 37°C for 10 minutes)
- Coupling Protein: Prioritize detection of Gs protein coupling, reduce GDP concentration to 1 μM
Explore TSHR Proteins
Learn More
General Experimental Procedure:
- MNP Activation: Pre-incubate MNPs (20 μg/reaction) with GDP (10 μM) in reaction buffer at room temperature for 15 minutes.
- Agonist Stimulation: Add concentration-gradient agonist, incubate at room temperature for 5 minutes.
- GTPγS Labeling: Add GTPγS[³⁵S] (final concentration 0.1-0.5 nM), incubate at 30°C for 30-90 minutes.
- Reaction Termination: Add 4°C termination buffer (20 mM Tris, 100 mM NaCl, 25 mM MgCl₂, pH 7.4).
- Rapid Filtration: Filter through GF/B membranes, wash 4 times, perform liquid scintillation counting.
- Data Analysis: EC₅₀ values reflect agonist potency, Eₘₐₓ reflects receptor expression level. Acceptance criteria: EC₅₀ difference from literature values <1 log unit, Eₘₐₓ signal/basal signal >3.
1.3 Ion Channel Detection: Fluorescent Dye Method for CLDN6 Barrier Function
The barrier function of tight junction protein CLDN6 (Claudin-6) is a key indicator for evaluating functional integrity of epithelial MNPs. Fluorescent dye permeability assay provides quantitative evaluation of paracellular permeability regulation by CLDN6-MNP-formed simulated tight junction barriers.
Experimental Design Principle: Utilize permeability changes of fluorescent tracers (e.g., FITC-dextran 4 kDa or ionic dye YC-3) to detect CLDN6-MNP barrier regulation of paracellular permeability.
Detailed Procedure:
- MNP Coating: Add CLDN6-MNPs (100 μg/mL) to Transwell inserts (0.4 μm pore size), incubate at 37°C for 2 hours to adsorb onto polyester membrane.
- Monolayer Formation: Replace with complete medium, continue culture for 24-48 hours to form confluent layer.
- Tight Junction Maturation: Add Ca²⁺ (1.8 mM) to promote tight junction maturation, culture for additional 24 hours.
- Fluorescent Dye Loading: Add FITC-dextran (1 mg/mL, 100 μL) to upper chamber, 600 μL PBS to lower chamber.
- Time-Series Detection: Incubate at 37°C, take 100 μL samples from lower chamber every 30 minutes, detect with fluorescence plate reader (excitation 485 nm, emission 528 nm).
- Permeability Calculation: Papp = (dQ/dt)/(A×C₀), where dQ/dt is fluorescence intensity change rate, A is membrane area, C₀ is initial concentration.
Positive and Negative Controls:
- Positive Control: Untransfected blank MNPs (high permeability)
- Negative Control: CLDN6-MNPs + 1 mM EGTA (chelates Ca²⁺ to disrupt tight junctions)
- Specificity Verification: Add anti-CLDN6 antibody (1 μg/mL) to block protein function, permeability should increase >50%
Acceptance Criteria:
- Relative permeability <30% of positive control
- TER value (transepithelial electrical resistance) >200 Ω·cm² (if equipped with resistance measurement system)
- Experimental repeatability CV <15%
2. Nanoparticle Physicochemical Characterization
2.1 Particle Size and Dispersity: Dynamic Light Scattering (DLS) Standard Operation
DLS is the preferred rapid detection method for evaluating MNP hydrated diameter, polydispersity index (PDI), and colloidal stability.
Key Sample Preparation:
- Concentration Optimization: Protein concentration 0.1-0.5 mg/mL to avoid multiple scattering
- Dust Removal: Filter all buffers through 0.02 μm membrane, prepare samples in clean room
- Temperature Equilibration: Equilibrate at 25°C for 5 minutes before measurement to avoid temperature gradient interference
Instrument Parameter Settings (Malvern Zetasizer example):
Malvern Zetasizer
- Measurement Angle: 173° backscatter (NIBS technology)
- Laser Wavelength: 633 nm
- Measurement Runs: At least 3 independent measurements, 15-20 runs each
- Viscosity and Refractive Index: Set buffer viscosity (e.g., 0.89 cP for PBS) and protein refractive index (1.45)
Data Analysis and Acceptance Criteria:
- Main Population Size: Should be distributed in 80-200 nm range
- PDI Value: Acceptance criteria <0.2, >0.3 indicates aggregation or heterogeneity
- Repeatability: CV <5% for three independent measurements
- Trend Analysis: Size increase >10 nm from initial value suggests protein corona formation or aggregation
Advanced Analysis:
- Size Distribution Graph: Check for secondary peaks >1 μm (aggregation indicator)
- Concentration Dependency: Dilution series to verify size stability, exclude concentration artifacts
- Angle Dependency: Multi-angle detection (11°-90°) to judge particle shape (spherical/non-spherical)
Common Problem Handling: If PDI >0.3, remove large aggregates by ultracentrifugation at 100,000×g for 30 minutes, or gentle filtration through 0.45 μm membrane (note risk of membrane protein loss).
2.2 Morphology Observation: Transmission Electron Microscopy (TEM) Sample Preparation and Imaging
TEM provides direct visual evidence of real MNP morphology, core-shell structure, and dispersion status.
Negative Staining Sample Preparation Protocol:
- Carbon Film Treatment: Treat 400-mesh copper grid with glow discharge for 30 seconds (hydrophilicity enhancement)
- Sample Adsorption: Apply 5 μL MNP solution (10-50 μg/mL) to copper grid, stand for 2 minutes
- Washing: Quickly blot excess liquid with filter paper, wash 2 times with PBS
- Negative Staining: Apply 2% phosphotungstic acid (PTA, pH 6.8) or 1% uranyl acetate for 30 seconds
- Drying: Blot dry with filter paper, vacuum dry at room temperature for 2 hours
Cryogenic Transmission Electron Microscopy (Cryo-TEM) Preparation (Recommended):
- Vitrification: Apply 3 μL sample to Quantifoil holey carbon film, rapidly plunge into liquid nitrogen-cooled ethane using manual or Vitrobot method
- Freezing Conditions: 100% humidity, 4°C temperature, blot time 3-5 seconds
- Transfer: Load onto Gatan 626 cryo-sample holder under liquid nitrogen protection
- Imaging: Low-dose mode imaging at -180°C (<20 e⁻/Ų)
Imaging Parameters and Analysis:
- Acceleration Voltage: 200 kV or 300 kV
- Magnification: 50,000×-150,000×
- Resolution: Point resolution ≤0.24 nm
- Key Observation Metrics:
- Core-Shell Structure: Confirm lipid bilayer integrity (thickness ~5-6 nm)
- Particle Uniformity: Count >200 particles to calculate size distribution
- Satellite Structures: Check for membrane fragments or empty particles
- Surface Roughness: Evaluate protein insertion density
Image Analysis Software:
- ImageJ/Fiji for size statistics and roundness analysis
- DigitalMicrograph for Fourier transform validation of membrane layer structure
Acceptance Criteria:
- Sphericity >0.85 (4πA/P²)
- Intact membrane coating rate >90%
- No obvious aggregation or fusion
2.3 Surface Charge: Zeta Potential Measurement and Stability Correlation
Zeta potential reflects MNP surface net charge and is a key indicator for predicting colloidal stability. For MNPs simulating natural cell membranes, surface charge should be near-neutral or slightly negative.
Standardized Measurement Conditions:
- Electrode Selection: DTS1070 adjustable gap electrode (avoids corrosion in high-salt buffers)
- Sample Concentration: 0.1-0.2 mg/mL
- Temperature: 25°C
- Electric Field Strength: 10-20 V/cm
- Measurement Runs: 3 independent measurements, at least 30 electrophoretic mobility determinations each
Buffer Optimization Strategy:
- Physiological Conditions: PBS (150 mM ionic strength) provides near-physiological environment
- Low Conductivity Option: 10 mM NaCl for high-sensitivity measurement
- Additive Effects: 0.1% BSA can reduce non-specific adsorption but masks true surface charge
Data Interpretation and Stability Correlation:
- Stable Range: |ζ| > 30 mV provides sufficient electrostatic repulsion
- MNP Characteristic Values: -10 to -30 mV is typical range (simulating natural membrane negative charge)
- Critical Threshold: |ζ| < 10 mV predicts aggregation risk
- pH Titration: Determine isoelectric point (pI), avoid storage within pI±1 range
Linked Analysis with Size Changes:
- If DLS shows increased size with unchanged ζ → Non-charge-driven aggregation (e.g., hydrophobic interaction)
- If ζ absolute value decreases with size increase → Electrostatic shielding-induced aggregation
- If ζ changes from negative to positive → Protein corona adsorption or membrane structure damage
Long-Term Monitoring Protocol: Measure ζ potential monthly, if change >5 mV, indicates surface protein shedding or oxidative modification; functional activity must be re-evaluated.
3. Batch Consistency Validation
3.1 Protein Density Quantification (BCA and ELISA Dual Validation)
Ensuring consistent functional protein density on MNP surface per batch is the core of quality control. Two independent methods are used for cross-validation to eliminate systematic errors.
BCA Method for Total Protein Quantification:
- Lysis Conditions: RIPA buffer + 1% SDS + protease inhibitors, sonicate at 70°C for 5 minutes
- Standard Curve: BSA standards 2-2000 μg/mL
- Microplate Method: 25:1 working reagent mixture, incubate at 37°C for 30 minutes, detect at 562 nm
- Conversion Factor: Subtract carrier particle protein background (empty MNP control)
Explore BCA Assay Kit
Learn More
ELISA for Specific Protein Quantification:
- Capture Antibody: Monoclonal antibody against target membrane protein extracellular domain (2 μg/mL coating)
- Blocking: 5% skim milk powder, overnight at 4°C
- Sample Binding: Serially diluted MNPs, incubate at 37°C for 2 hours
- Detection Antibody: HRP-labeled secondary antibody (1:5000), TMB substrate development
- Quantification Strategy: Standard curve using purified recombinant protein (0.1-100 ng/mL)
Dual-Validation Acceptance Criteria:
- BCA-ELISA Ratio: 0.8-1.2 (large deviation indicates non-specific protein adsorption or incomplete purification)
- Inter-batch CV: <10% (n=3 independent batches)
- Recovery Rate: Spike recovery 85-115%
Functional Protein Ratio Calculation: Active ligand binding site density/ELISA total protein density should be >60%; if too low, suggests protein misfolding or improper orientation.
3.2 Ligand Binding Saturation Curves (Bmax and Kd Value Batch Comparison)
Establish batch release reference standards; set acceptance ranges through multi-batch saturation curve parameter statistics.
Statistical Process Control (SPC) Implementation:
- Historical Data Accumulation: Data from at least 10 qualified production batches
- Bmax Control Chart: Calculate mean ±2SD as warning limits, ±3SD as action limits
- Kd Monitoring: Use %CV control, acceptance criteria CV <20%
- Trend Analysis: CUSUM chart to detect small drifts
Batch Comparison Experimental Design:
- Simultaneous Detection: Test batch and reference standard on same 96-well plate
- Concentration Matching: Total protein concentration must be strictly consistent (±5%)
- Curve Overlap Index: Calculate AUC ratio of two curves, 0.9-1.1 is acceptable
Abnormal Batch Investigation:
- If Bmax decreases but Kd unchanged → Protein density reduction (production issue)
- If Bmax unchanged but Kd right-shifted → Protein activity decrease (storage/handling issue)
- If both Bmax and Kd change → Systematic process failure
Report Template: Each batch should include saturation curve graph, binding parameter table, overlay graph with standard, and SPC control chart positioning.
3.3 Accelerated Stability Testing (37°C Challenge Test)
Simulates long-term storage conditions to rapidly evaluate MNP physical and functional stability under stress.
Experimental Design Matrix:
| Time Points | Temperature | Detection Items |
|---|---|---|
| 0, 7, 14, 21, 28 days | 37°C | DLS, Zeta, BCA, Ligand binding |
| 0, 3, 7, 14 days | 37°C | TEM, GTPγS |
Procedure:
- Aliquoting: 200 μL per aliquot, seal in low-adsorption tubes, avoid repeated sampling
- Storage: Incubator at constant temperature, protected from light
- Sampling: Remove at scheduled time points, immediately cool to 4°C and test
- Endpoint Determination: Terminate when activity decreases >20% or PDI >0.3
Degradation Kinetics Analysis:
- First-Order Kinetic Model: ln(A/A₀) = -kt, calculate activity half-life t₁/₂
- Arrhenius Equation: Combine 4°C, 25°C, 37°C data to predict real storage time at 2-8°C
- Acceptance Criterion: >80% ligand binding activity retained after 28 days at 37°C
Degradation Mechanism Identification:
- Protein Shedding: BCA shows total protein decrease >10%
- Oxidative Modification: Western blot detects carbonylated bands
- Lipid Oxidation: TBARS assay detects MDA content
- Aggregation: DLS size increase >20%
Storage Condition Optimization: Add protectants based on challenge test results:
- Protein Protection: 5% sucrose or trehalose
- Antioxidant: 0.01% BHT or EDTA
- pH Stability: 10 mM HEPES buffer
4. Common Problems and Solutions
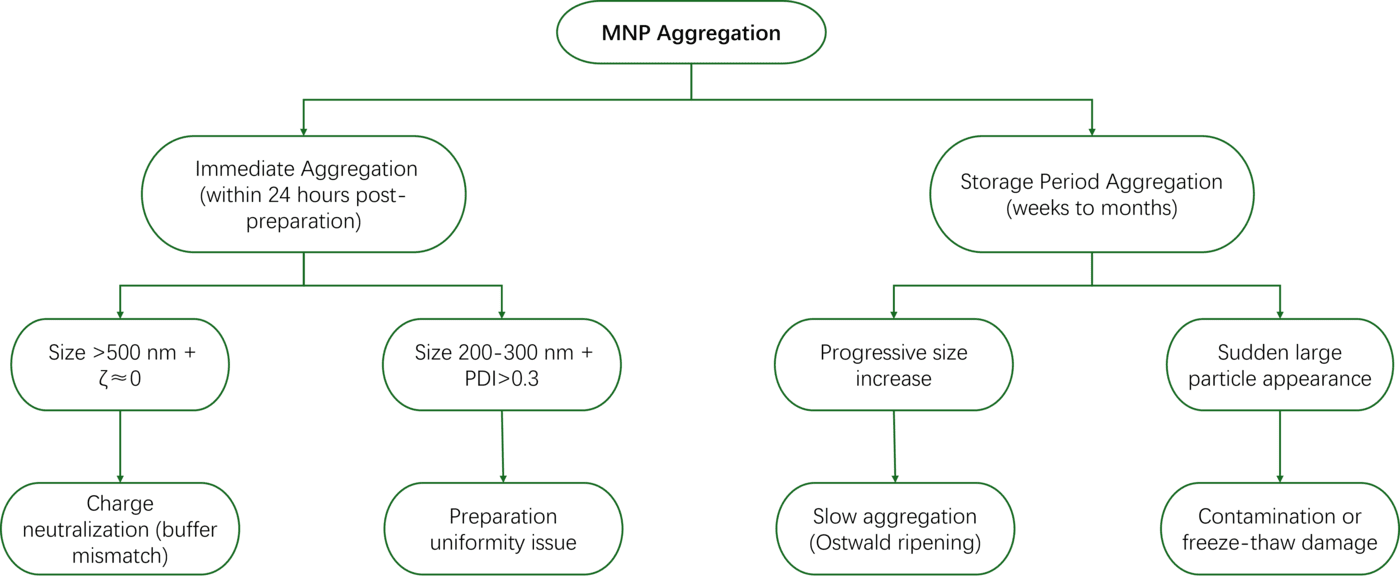
4.1 MNP Aggregation Mechanism Analysis and Dispersion Techniques
Aggregation Mechanism Diagnostic Tree:
Immediate Dispersion Techniques:
- Ultrasonication: Water bath sonication (40 kHz, 100 W) for 5-10 minutes; avoid probe sonication (destroys membrane structure)
- Shear Force Dispersion: Pass through 0.22 μm syringe filter 5-10 times; pre-clear with 0.1 μm filter to remove large particles
- Surfactants: Gentle types like Pluronic F-127 (0.01-0.1%) or CHAPS (1 mM); avoid SDS
- pH Adjustment: Briefly adjust to pH 8.0-8.5 then readjust, utilize charge repulsion for dispersion
Long-Term Stability Strategy:
- Storage Density: Optimize to 1-2 mg/mL; too low concentration increases collision probability
- Container Material: Use siliconized low-adsorption tubes; avoid glass surface silanol adsorption
- Temperature Cycling: Avoid frequent temperature fluctuations; recommend stable storage at 4°C
- Aseptic Operation: Filter sterilize with 0.22 μm filter; microbial contamination is a common aggregation cause
Quality Re-evaluation: After dispersion treatment, must re-measure:
- DLS to confirm size recovery
- TEM to verify membrane integrity not compromised
- Ligand binding assay to confirm function not lost
4.2 Effects of Freeze-Thaw on Nanoparticle Structure
Freeze-Thaw Damage Mechanisms:
Ice Crystal Formation Phase (-1°C to -20°C):
- Extracellular ice crystal growth punctures lipid bilayer
- "Salting-out effect" causes local ionic strength to surge >1 M, destroying protein structure
- Interface tension changes cause membrane protein dissociation
Glass Transition Phase (< -80°C):
- Lipid phase separation, loss of membrane fluidity
- Protein conformation freezes in inactive state
Rewarming Phase:
- Recrystallization causes additional damage
- Oxidative stress increases
Cryoprotectant Screening Experiment:
| Cryoprotectant | Concentration | Protection Mechanism | Compatibility |
|---|---|---|---|
| Trehalose | 5-10% | Hydrogen bond water replacement | ★★★★★ |
| Glycerol | 10% | Depression of freezing point | ★★★☆☆ |
| PEG400 | 5% | Steric hindrance | ★★★★☆ |
| BSA | 1% | Surface coating | ★★☆☆☆ (interferes with quantification) |
Freeze-Thaw Protocol Optimization:
- Controlled Rate Freezing: Use gradient freezing container (-1°C/min) to -80°C, then transfer to liquid nitrogen
- Rapid Thawing: Thaw quickly in 37°C water bath (<1 minute), avoid slow warming
- Cryoprotectant Addition Principle: Prioritize excipients that don't interfere with downstream experiments
- Aliquoting Strategy: Single-use aliquots (50-100 μL), eliminate repeated freeze-thaw cycles
Damage Assessment and Remediation:
- Mild Damage (activity decrease <20%): Self-repair by standing at 4°C for 24 hours
- Moderate Damage (activity decrease 20-50%): Add liposomes (1:10 molar ratio) and co-incubate at 37°C for 2 hours to promote membrane fusion repair
- Severe Damage (activity decrease >50%): Not recommended for use; requires re-preparation
4.3 Remedial Measures for Activity Loss After Long-Term Storage
Activity Loss Diagnosis: First distinguish between reversible inactivation and irreversible degradation:
Reversible Inactivation Characteristics:
- Ligand binding activity decreases but BCA protein content unchanged
- TEM shows intact membrane structure
- Activity partially restored by adding reducing agent (1 mM DTT)
Irreversible Degradation Characteristics:
- Degradation bands appear (Western blot)
- DLS particle size significantly increases
- Activity not restored by additives
Stepwise Rescue Protocol:
Level 1: Formulation Optimization (During Storage Intervention)
- Buffer Exchange: Replace PBS with 20 mM HEPES, 150 mM NaCl, pH 7.4 to reduce phosphate-catalyzed oxidation
- Inert Gas: Seal with nitrogen or argon, reduce oxidation rate by 2-3 fold
- Add Cocktail: Protease inhibitors (1×) + antioxidant (0.01% BHT) + metal chelator (0.1 mM EDTA)
Level 2: In Vitro Reactivation (Pre-Use Treatment)
- Lipid Reconstitution: Co-incubate with freshly extracted natural liposomes (PC:PE:Chol = 4:3:3) at 37°C for 1 hour, molar ratio MNP:liposome = 1:50
- Molecular Chaperone Assistance: Add Hsp70 system (0.5 μM Hsp70 + 0.2 μM Hsp40 + 2 mM ATP), incubate at 30°C for 30 minutes
- Mild Detergent: Briefly treat with mild detergent like DDM (0.02%) for 5 minutes then dialyze away, can reset protein conformation
Level 3: Functional Enrichment (Before Downstream Application)
- Affinity Purification: Capture high-activity MNPs with ligand-coupled magnetic beads to remove inactive particles
- Biotin-labeled ligand + streptavidin magnetic beads
- Incubate in binding buffer, separate with magnetic stand
- Activity recovery typically 30-50%, but activity can recover to fresh preparation level
- Density Gradient Centrifugation: OptiPrep gradient (5-20%), centrifuge at 40,000×g for 4 hours; active particles distribute in specific layers due to membrane density differences
Final Decision Tree:
- Activity decrease <15% → Use directly, no treatment needed
- Decrease 15-30% → Level 2 reactivation
- Decrease 30-50% → Use after Level 3 enrichment
- Decrease >50% → Discard, optimize preparation process
Preventive Strategy:
- Real-Time Monitoring: Install RFID temperature loggers for each batch for complete cold-chain traceability
- Retention Sample System: Retain 3 samples per batch (4°C, -80°C, liquid nitrogen), test regularly
- Shelf-Life Setting: Set reasonable expiration date based on accelerated experimental data (typically 6-12 months)
This SOP constitutes a standardized operational framework for the quality control system provided by Creative BioMart. For further information about our products and services, please contact us.
Related Products and Services
Resource
-
Unlocking Drug Targets with Membrane Protein Nanoparticles!
-
Membrane Protein Platforms: 6-Way Showdown!
-
Mastering Membrane Protein Platforms in 3 Minutes!
Contact us or send an email at for project quotations and more detailed information.
Quick Links
-

Papers’ PMID to Obtain Coupon
Submit Now -

Refer Friends & New Lab Start-up Promotions