


Recombinant Human Argininosuccinate Lyase, His-tagged
| Cat.No. : | ASL-1271H |
| Product Overview : | Recombinant human ASL protein, fused to His-tag at N-terminus, was expressed in E.coli and purified by using conventional chromatography techniques. |
- Specification
- Gene Information
- Related Products
- Citation
- Download
| Species : | Human |
| Source : | Human |
| Tag : | His |
| Description : | ASL (argininosuccinate lyase) belongs to the lyase 1 family. ASL is an enzyme that catalyzes the reversible breakdown of argininosuccinate (ASA) producing the amino acids arginine and fumarate. Located in liver cytosol, ASL is the fourth enzyme of the urea cycle and involved in the biosynthesis of arginine in all species and the production of urea in ureotelic species. While ASS (argininosuccinate synthetase) catalyzes the formation of argininosuccinate from citrulline and aspartate, ASL breaks the newly formed argininosuccinate into L-arginine and fumarate. L-arginine continues through the urea cycle to form urea and orinthine, while fumarate can enter the citric acid cycle. |
| Form : | Liquid. In 20mM Tris-HCl buffer (pH 8.0) containing 2mM DTT, 10% glycerol, 100mM NaCl |
| Molecular Weight : | 53.8kDa (484aa) |
| Purity : | > 95% by SDS - PAGE |
| Concentration : | 0.5mg/ml (determined by Bradford assay) |
| Sequences of amino acids : | MGSSHHHHHH SSGLVPRGSH MASESGKLWG GRFVGAVDPI MEKFNASIAY DRHLWEVDVQ GSKAYSRGLE KAGLLTKAEM DQILHGLDKV AEEWAQGTFK LNSNDEDIHT ANERRLKELI GATAGKLHTG RSRNDQVVTD LRLWMRQTCS TLSGLLWELI RTMVDRAEAE RDVLFPGYTH LQRAQPIRWS HWILSHAVAL TRDSERLLEV RKRINVLPLG SGAIAGNPLG VDRELLRAEL NFGAITLNSM DATSERDFVA EFLFWASLCM THLSRMAEDL ILYCTKEFSF VQLSDAYSTG SSLMPQKKNP DSLELIRSKA GRVFGRCAGL LMTLKGLPST YNKDLQEDKE AVFEVSDTMS AVLQVATGVI STLQIHQENM GQALSPDMLA TDLAYYLVRK GMPFRQAHEA SGKAVFMAET KGVALNQLSL QELQTISPLF SGDVICVWDY GHSVEQYGAL GGTARSSVDW QIRQVRALLQ AQQA |
| Storage : | Can be stored at +4°C short term (1-2 weeks). For long term storage, aliquot and store at -20°C or -70°C. Avoid repeated freezing and thawing cycles. |
| Pathways : | Alanine and aspartate metabolism; Alanine, aspartate and glutamate metabolism; Arginine and proline metabolism; Metabolic pathways; Metabolism of amino acids and derivatives; Urea cycle; Urea cycle and metabolism of amino groups; arginine biosynthesis IV |
| Gene Name | ASL argininosuccinate lyase [ Homo sapiens ] |
| Official Symbol | ASL |
| Synonyms | ASL; ASAL; argininosuccinate lyase; arginosuccinase; argininosuccinase; OTTHUMP00000159903; OTTHUMP00000210324; OTTHUMP00000210325; OTTHUMP00000210326; OTTHUMP00000210327 |
| Gene ID | 435 |
| mRNA Refseq | NM_000048 |
| Protein Refseq | NP_000039 |
| MIM | 608310 |
| UniProt ID | P04424 |
| Chromosome Location | 7cen-q11.2 |
| Function | argininosuccinate lyase activity; catalytic activity; lyase activity |
Early prediction of phenotypic severity in Citrullinemia Type 1
Journal: Annals of Clinical and Translational Neurology PubMed ID: 31469252 Data: 2019/8/30
Authors: Matthias Zielonka, Stefan K?lker, Roland Posset
Article Snippet:Purified citrate synthase, malate dehydrogenase, and fumarase from porcine heart were purchased from Sigma‐Aldrich.Purified citrate synthase, malate dehydrogenase, and fumarase from porcine heart were purchased from Sigma‐Aldrich.. Recombinant C‐terminally FLAG‐tagged argininosuccinate lyase protein was obtained from Creative BioMart.. ASS1 enzyme activity was determined in transfected COS‐7 cell lysates (triplicates) in a buffer containing 10 mmol/L potassium phosphate, 10 mmol/L TRIS‐HCl, 2 mmol/L citrulline, 600 mU/mL of argininosuccinate lyase, 650 mU/mL fumarase, 660 mU/mL malate dehydrogenase, 400 mU/mL citrate synthase, 2 mmol/L aspartic acid, 330 μ mol/L NAD, 100 μ mol/L acetyl‐CoA and 2 mmol/L ATP, which was adjusted to pH 7.4 (25°C).ASS1 enzyme activity was determined in transfected COS‐7 cell lysates (triplicates) in a buffer containing 10 mmol/L potassium phosphate, 10 mmol/L TRIS‐HCl, 2 mmol/L citrulline, 600 mU/mL of argininosuccinate lyase, 650 mU/mL fumarase, 660 mU/mL malate dehydrogenase, 400 mU/mL citrate synthase, 2 mmol/L aspartic acid, 330 μ mol/L NAD, 100 μ mol/L acetyl‐CoA and 2 mmol/L ATP, which was adjusted..
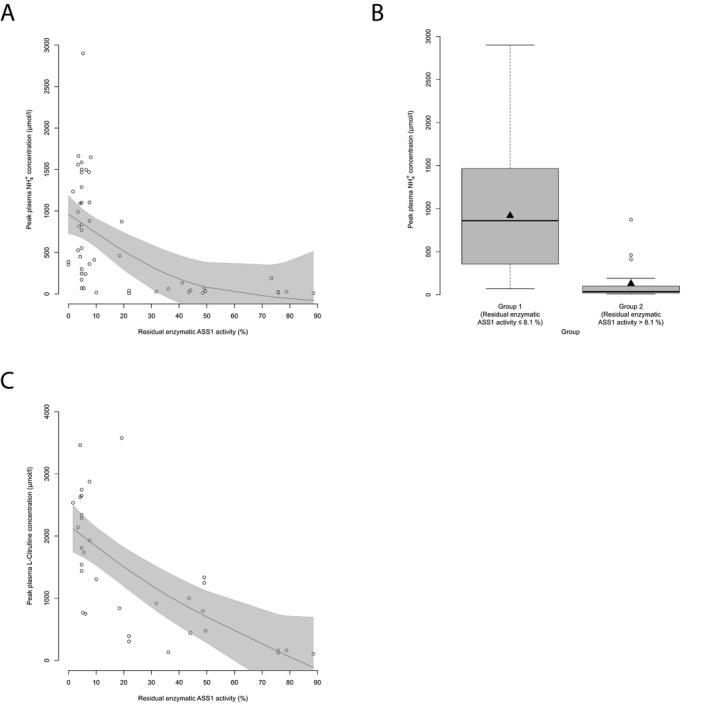
Residual enzymatic ASS1 activity correlates with initial biochemical parameters. (A) NH 4 + max ( μ mol/L) subject to residual enzymatic ASS1 activity (%) as determined in the biallelic expression system. Each point represents a single patient ( n = 52). Gray line displays estimated regression curve. GAM‐analysis, P < 0.001, R 2 = 0.29. (B) Boxplot illustrating NH 4 + max ( μ mol/L) with a residual enzymatic ASS1 activity below or equal to 8.1% ( n = 32) and above 8.1% ( n = 20). Data are shown as median (black thick line) and mean (triangle), length of the box corresponds to interquartile range (IQR), upper and lower whiskers correspond to max. 1.5 × IQR, each point represents an outlier. Recursive partitioning, P < 0.001. (C) Peak plasma L‐citrulline concentration subject to residual enzymatic ASS1 activity (%). Each point represents a single patient ( n = 33). Gray line displays estimated regression curve. GAM‐analysis, P < 0.001, R 2 = 0.46. ASS1,
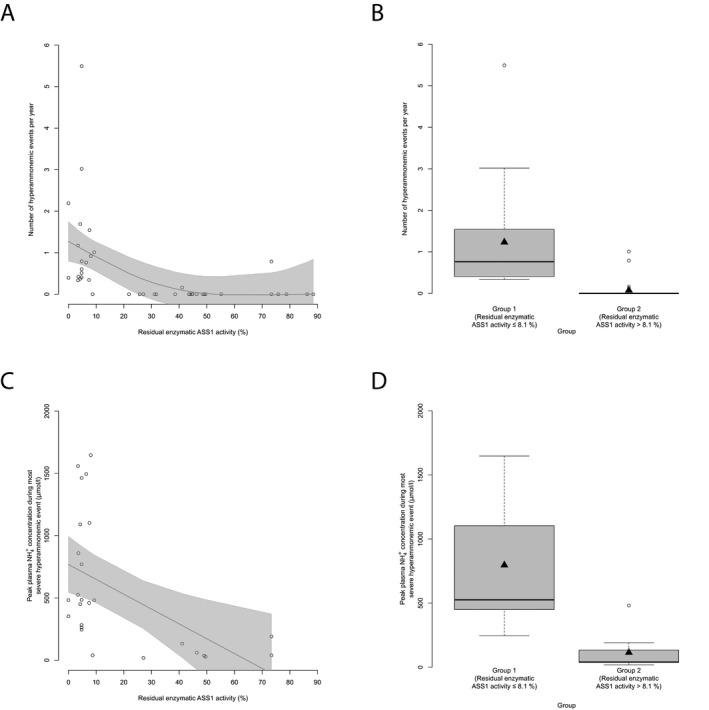
Residual enzymatic ASS1 activity predicts number and severity of HAEs. (A) Number of HAEs (NH 4 + max ≥ 100 μ mol/L) per year subject to residual enzymatic ASS1 activity (%). Each point represents a single patient ( n = 43). Gray line displays estimated regression curve. GAM‐analysis, P = 0.002, R 2 = 0.26. (B) Boxplot illustrating number of HAEs (NH 4 + max ≥ 100 μ mol/L) per year with a residual enzymatic ASS1 activity below or equal to 8.1% ( n = 17) or above 8.1% ( n = 26). Data are shown as median (black thick line) and mean (triangle), length of the box corresponds to IQR, upper and lower whiskers correspond to max. 1.5 × IQR, each point represents an outlier. Recursive partitioning, P = 0.003. (C) NH 4 + max during most severe HAE subject to residual enzymatic ASS1 activity (%). Each point represents a single patient ( n = 26). Gray line displays estimated regression curve. GAM‐analysis, P = 0.007, R 2 = 0.23. (D) Boxplot illustrating NH 4 + max during most severe HAE with a residual enzymatic ASS1 activity below or equal to 8.1% ( n = 17) or above 8.1% ( n = 9). Data are shown as median (black thick line) and mean (triangle), length of the box corresponds to IQR, upper and lower whiskers correspond to max. 1.5 × IQR, each point represents an outlier. Recursive partitioning, P = 0.01. ASS1,
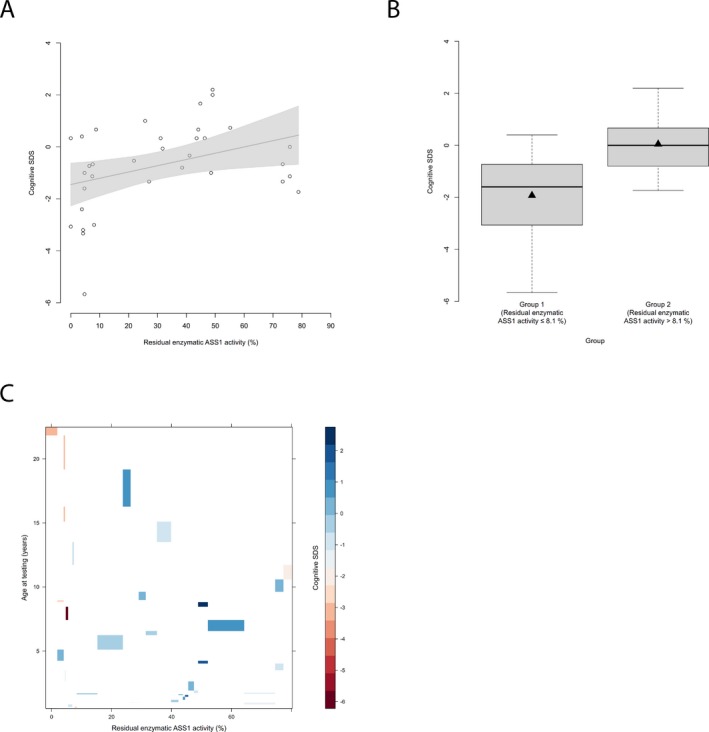
Residual enzymatic ASS1 activity correlates with cognitive outcome. (A) Cognitive SDS subject to residual enzymatic ASS1 activity (%). Each point represents a single patient ( n = 34). Grey line indicates linear regression curve. Linear regression, P = 0.029, R 2 = 0.14. (B) Boxplot illustrating cognitive SDS with a residual enzymatic ASS1 activity below or equal to 8.1% ( n = 13) and above 8.1% ( n = 21). Data are shown as median (black thick line) and mean (triangle), length of the box corresponds to IQR, upper and lower whiskers correspond to max. 1.5 × IQR. Recursive partitioning, P = 0.031. (C) Levelplot for cognitive SDS, residual enzymatic ASS1 activity and age at testing (years). Cognitive SDS values are indicated by color coding in grading from blue to red with descending cognitive SDS. ASS1,
Not For Human Consumption!
Inquiry
- Reviews (0)
- Q&As (0)


Ask a Question for All ASL Products
Required fields are marked with *
My Review for All ASL Products
Required fields are marked with *