


Recombinant Human DYRK1B, GST-tagged
| Cat.No. : | DYRK1B-12237H |
| Product Overview : | Recombinant Human DYRK1B protein, fused to GST-tag, was expressed in E.coli and purified by GSH-sepharose. |
| Availability | July 29, 2026 |
| Unit | |
| Price | |
| Qty |
- Specification
- Gene Information
- Related Products
- Citation
- Download
| Species : | Human |
| Source : | E.coli |
| Tag : | GST |
| Protein Length : | 111-431a.a. |
| Description : | DYRK1B is a member of the DYRK family of protein kinases. DYRK1B contains a bipartite nuclear localization signal and is found mainly in muscle and testis. The protein is proposed to be involved in the regulation of nuclear functions. Three isoforms of DYRK1B have been identified differing in the presence of two alternatively spliced exons within the catalytic domain. |
| Storage : | The protein is stored in PBS buffer at -20℃. Avoid repeated freezing and thawing cycles. |
| Storage Buffer : | 1M PBS (58mM Na2HPO4,17mM NaH2PO4, 68mM NaCl, pH8. ) added with 100mM GSH and 1% Triton X-100,15%glycerol. |
| Gene Name | DYRK1B dual-specificity tyrosine-(Y)-phosphorylation regulated kinase 1B [ Homo sapiens ] |
| Official Symbol | DYRK1B |
| Synonyms | DYRK1B; dual-specificity tyrosine-(Y)-phosphorylation regulated kinase 1B; dual specificity tyrosine-phosphorylation-regulated kinase 1B; minibrain related kinase; MIRK; mirk protein kinase; minibrain-related kinase; |
| Gene ID | 9149 |
| mRNA Refseq | NM_004714 |
| Protein Refseq | NP_004705 |
| MIM | 604556 |
| UniProt ID | Q9Y463 |
| Chromosome Location | 19q12-q13.1 |
| Function | ATP binding; nucleotide binding; protein binding; protein kinase activity; protein serine/threonine kinase activity; protein serine/threonine/tyrosine kinase activity; protein tyrosine kinase activity; transcription coactivator activity; |
| ◆ Recombinant Proteins | ||
| DYRK1B-0396H | Recombinant Human DYRK1B Protein (A2-S629), Tag Free | +Inquiry |
| DYRK1B-7638Z | Recombinant Zebrafish DYRK1B | +Inquiry |
| DYRK1B-1364R | Recombinant Rhesus monkey DYRK1B Protein, His-tagged | +Inquiry |
| DYRK1B-12237H | Recombinant Human DYRK1B, GST-tagged | +Inquiry |
| DYRK1B-0397H | Recombinant Human DYRK1B Protein (A2-S629), GST tagged | +Inquiry |
| ◆ Cell & Tissue Lysates | ||
| DYRK1B-6751HCL | Recombinant Human DYRK1B 293 Cell Lysate | +Inquiry |
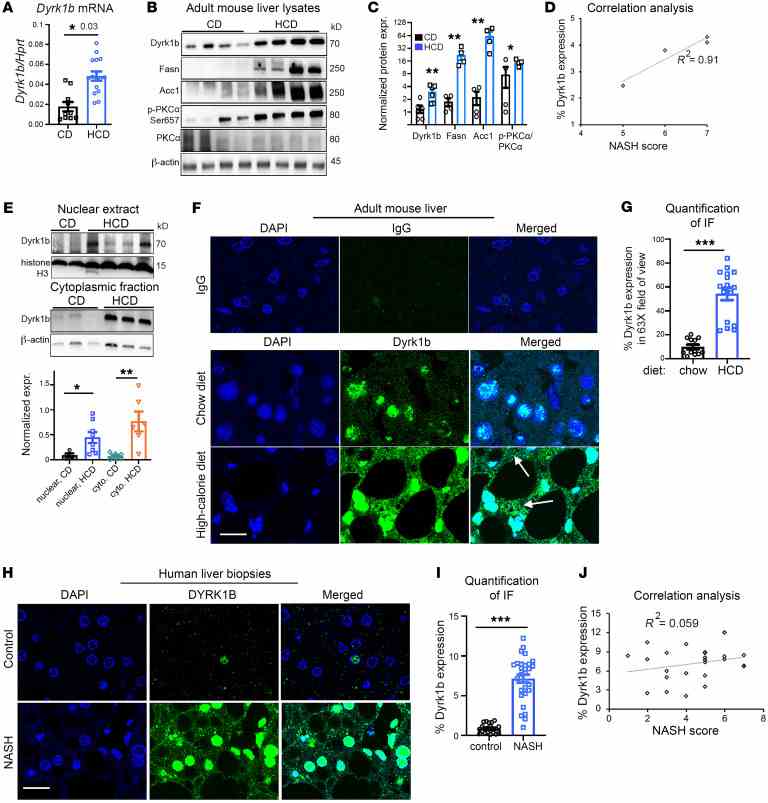
Dyrk1b promotes hepatic lipogenesis by bypassing canonical insulin signaling and directly activating mTORC2 in mice
Journal: The Journal of Clinical Investigation PubMed ID: 34855620 Data: 2022/2/1
Authors: Neha Bhat, Anand Narayanan, Arya Mani
Article Snippet:All incubations at 4°C were done on an end-to-end rotator.All incubations at 4°C were done on an end-to-end rotator.. For the kinase reactions involving purified proteins, the immunoprecipitated mTORC2 or IgG was incubated with purified recombinant human DYRK1B (rhDYRK1B; Creative BioMart, DYRK1B-2983H, 81% pure) in the KRB buffer plus 500 μM ATP.. To pharmacologically inhibit DYRK1B, the rhDYRK1B was preincubated in either DMSO or AZ191 at a concentration of 10 μM for 10 minutes at room temperature.To pharmacologically inhibit DYRK1B, the rhDYRK1B was preincubated in either DMSO or AZ191 at a concentration of 10 μM for 10 minutes at room temperature.
( A )
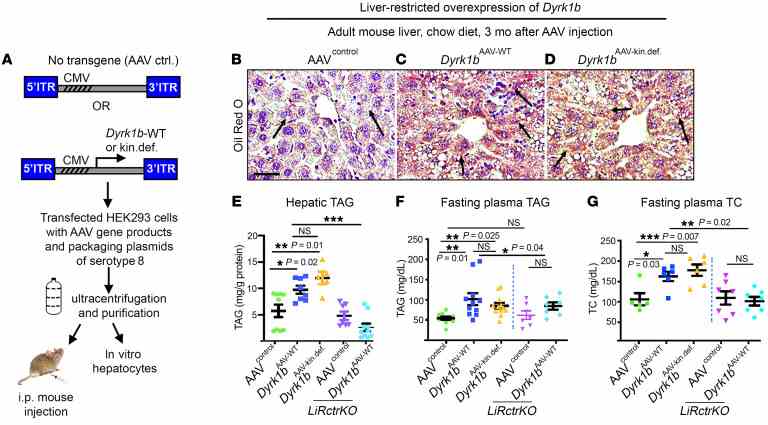
( A ) Schematic representation of generation of AAV8 for increasing
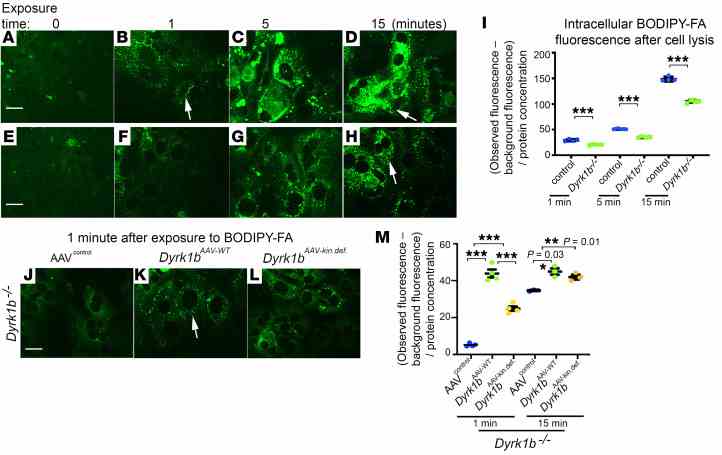
( A – H ) Representative confocal images from littermate controls and
Not For Human Consumption!
Inquiry
- Reviews (0)
- Q&As (0)


Ask a Question for All DYRK1B Products
Required fields are marked with *
My Review for All DYRK1B Products
Required fields are marked with *