
Recombinant Human TMPRSS2
| Cat.No. : | TMPRSS2-30144TH |
| Product Overview : | Recombinant fragment of Human TMPRSS2 with a proprietary tag; predicted mwt: 37.73 kDa. |
- Specification
- Gene Information
- Related Products
- Citation
- Download
| Species : | Human |
| Source : | Wheat Germ |
| Tag : | Non |
| Protein Length : | 110 amino acids |
| Description : | This gene encodes a protein that belongs to the serine protease family. The encoded protein contains a type II transmembrane domain, a receptor class A domain, a scavenger receptor cysteine-rich domain and a protease domain. Serine proteases are known to be involved in many physiological and pathological processes. This gene was demonstrated to be up-regulated by androgenic hormones in prostate cancer cells and down-regulated in androgen-independent prostate cancer tissue. The protease domain of this protein is thought to be cleaved and secreted into cell media after autocleavage. Alternatively spliced transcript variants encoding different isoforms have been found for this gene. |
| Molecular Weight : | 37.730kDa inclusive of tags |
| Tissue specificity : | Expressed strongly in small intestine. Also expressed in prostate, colon, stomach and salivary gland. |
| Form : | Liquid |
| Purity : | Proprietary Purification |
| Storage buffer : | pH: 8.00Constituents:0.31% Glutathione, 0.79% Tris HCl |
| Storage : | Shipped on dry ice. Upon delivery aliquot and store at -80oC. Avoid freeze / thaw cycles. |
| Sequences of amino acids : | GWGATEEKGKTSEVLNAAKVLLIETQRCNSRYVYDNLITPAMICAGFLQGNVDSCQGDSGGPLVTSKNNIWWLIGDTSWGSGCAKAYRPGVYGNVMVFTDWIYRQMRADG |
| Sequence Similarities : | Belongs to the peptidase S1 family.Contains 1 LDL-receptor class A domain.Contains 1 peptidase S1 domain.Contains 1 SRCR domain. |
| Gene Name | TMPRSS2 transmembrane protease, serine 2 [ Homo sapiens ] |
| Official Symbol | TMPRSS2 |
| Synonyms | TMPRSS2; transmembrane protease, serine 2; transmembrane protease serine 2; PRSS10; |
| Gene ID | 7113 |
| mRNA Refseq | NM_005656 |
| Protein Refseq | NP_005647 |
| MIM | 602060 |
| Uniprot ID | O15393 |
| Chromosome Location | 21q22.3 |
| Pathway | Coregulation of Androgen receptor activity, organism-specific biosystem; Influenza A, organism-specific biosystem; Influenza A, conserved biosystem; Regulation of Androgen receptor activity, organism-specific biosystem; Transcriptional misregulation in cancers, organism-specific biosystem; |
| Function | peptidase activity; scavenger receptor activity; serine-type endopeptidase activity; serine-type peptidase activity; |
| ◆ Recombinant Proteins | ||
| TMPRSS2-8077H | Recombinant Human TMPRSS2 protein, His-tagged | +Inquiry |
| TMPRSS2-30144TH | Recombinant Human TMPRSS2 | +Inquiry |
| TMPRSS2-4591H | Recombinant Human TMPRSS2 protein, His-tagged | +Inquiry |
| TMPRSS2-086H | Recombinant Human TMPRSS2 Protein, His-tagged | +Inquiry |
| TMPRSS2-427H | Recombinant Human TMPRSS2 Protein, His-tagged | +Inquiry |
| ◆ Cell & Tissue Lysates | ||
| TMPRSS2-910HCL | Recombinant Human TMPRSS2 293 Cell Lysate | +Inquiry |
Native and activated antithrombin inhibits TMPRSS2 activity and SARS‐CoV‐2 infection
Journal: Journal of Medical Virology PubMed ID: 36056630 Data: 2022/9/16
Authors: Lukas Wettstein, Patrick Immenschuh, Jan Münch
Article Snippet:AT was obtained from CSL Behring (Kybernin?) and Grifols (Anbinex?) and solubilized in ddH 2 O, Fondaparinux (SML1240) and heparin (H3149) were obtained from Merck, Boc‐Gln‐Ala‐Arg‐AMC peptide was obtained from Bachem (4017019.0005), EK1 peptide (H2N‐SLDQINVTFLDLEYEMKKLEEAIKKLEESYIDLKEL‐COOH) was synthesized in‐house by solid phase synthesis.AT was obtained from CSL Behring (Kybernin?) and Grifols (Anbinex?) and solubilized in ddH 2 O, Fondaparinux (SML1240) and heparin (H3149) were obtained from Merck, Boc‐Gln‐Ala‐Arg‐AMC peptide was obtained from Bachem (4017019.0005), EK1 peptide (H2N‐SLDQINVTFLDLEYEMKKLEEAIKKLEESYIDLKEL‐COOH) was synthesized in‐house by solid phase synthesis.. Recombinant TMPRSS2 was obtained from CreativeBiomart (TMPRSS2‐1856H) or LSBio (LS‐G57269).
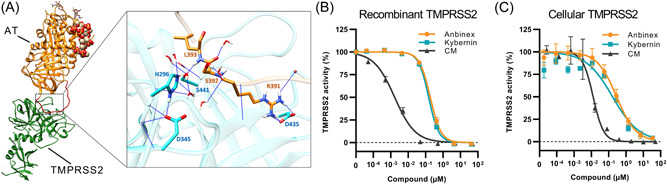
Antithrombin inhibits
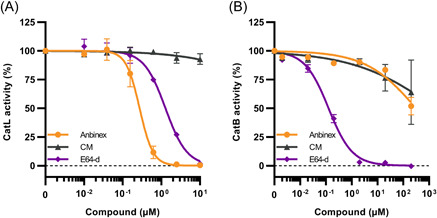
Antithrombin inhibits activity of cathepsin L, while moderately affecting cathepsin B. Recombinant cathepsin L (A) or isolated cathepsin B (B) were incubated with AT (Anbinex), small molecule
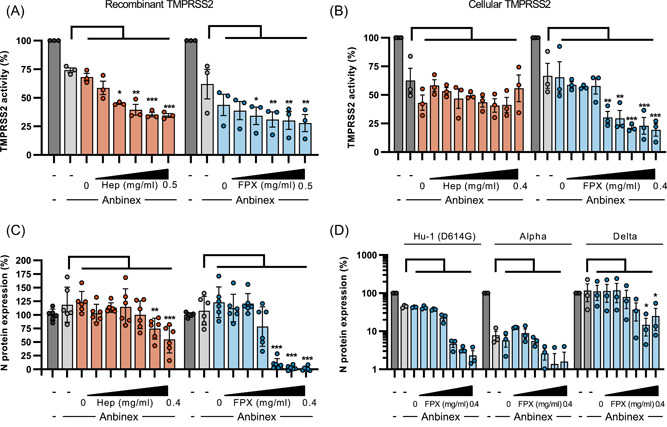
Activation of antithrombin increases
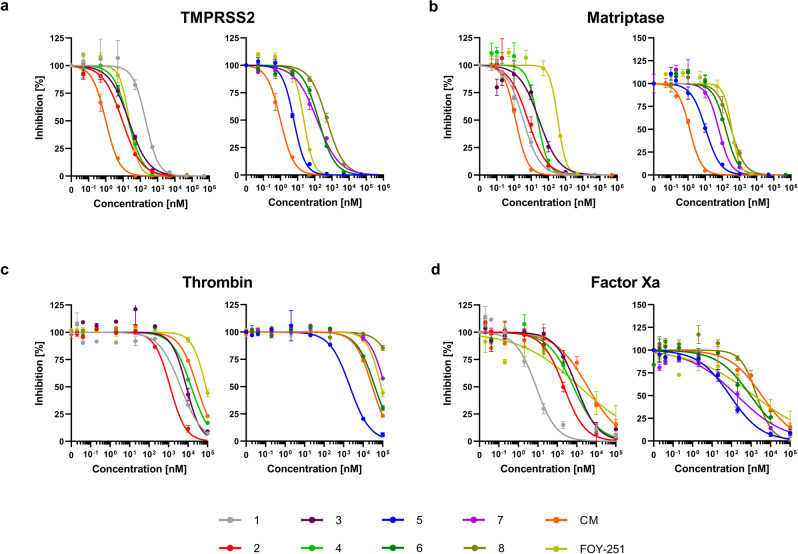
Peptidomimetic inhibitors of TMPRSS2 block SARS-CoV-2 infection in cell culture
Journal: Communications Biology PubMed ID: 35804152 Data: 2022/7/8
Authors: Lukas Wettstein, Philip Maximilian Knaff, Volker Mail?nder
Article Snippet:Recombinant human TMPRSS2 was purchased from Creative BioMart (New York, USA) or LSBio (Seattle, USA), factor Xa was obtained from Bio-Techne GmbH (Wiesbaden, Germany).. Recombinant human thrombin and matriptase protein were purchased from R&D Systems (Minneapolis, MN, USA).Recombinant human thrombin and matriptase protein were purchased from R&D Systems (Minneapolis, MN, USA).
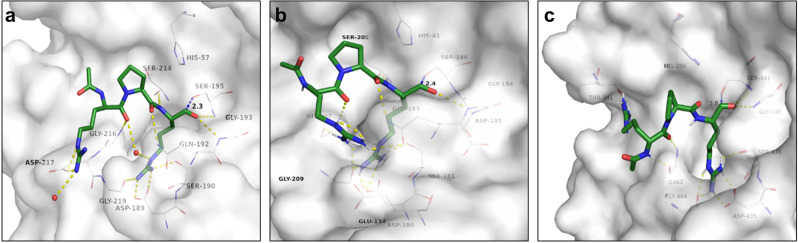
a Docking of ace- d -Arg-Pro-Arg-aldehyde reference binder to matriptase surrogate model (white carbon atoms and surface). For a clear view, only residues forming polar interactions (yellow dashed lines), and the catalytic residues Ser-195 and His-57 are depicted. b Docking of ace- d -Arg-Pro-Arg-aldehyde reference binder to hepsin-based
Isolated
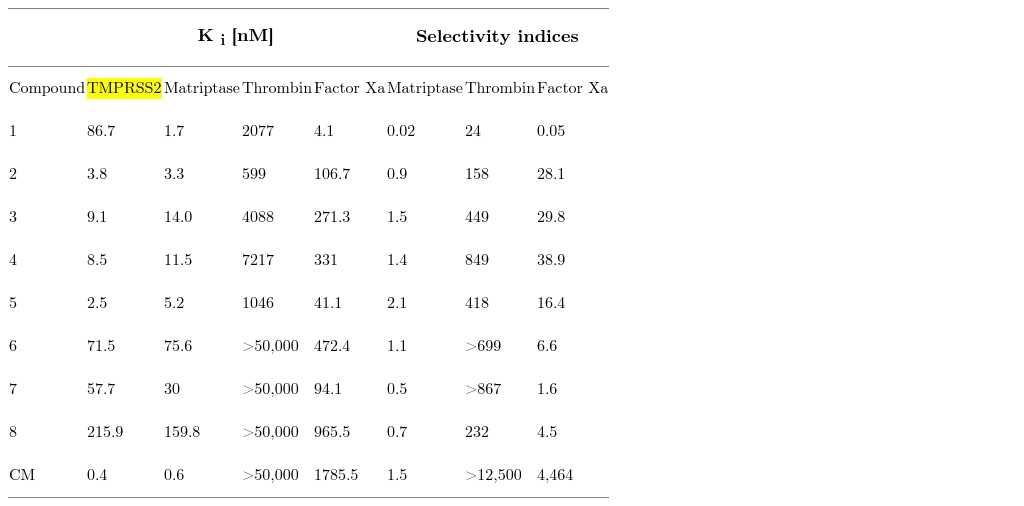
Inhibitory activity ( K i ) of synthesized TMPRSS2 inhibitors 1–8 against
Molecular Interactions of Tannic Acid with Proteins Associated with SARS-CoV-2 Infectivity
Journal: International Journal of Molecular Sciences PubMed ID: 35269785 Data: 2022/2/27
Authors: Mohamed Haddad, Roger Gaudreault, Raffaele Marfella
Article Snippet:Biotinylated recombinant human ACE2 with purity >95% and camostat mesylate compound were both purchased from R&D Systems (Minneapolis, MN, USA).Biotinylated recombinant human ACE2 with purity >95% and camostat mesylate compound were both purchased from R&D Systems (Minneapolis, MN, USA).. Recombinant human TMPRSS2 protein (106–492 aa), with a MW of 44.8 kDa, was purchased from Creative BioMart.. The protein was produced by a yeast expression system with a His-tag at the N-terminal and with purity >90% as determined by SDS-PAGE.The protein was produced by a yeast expression system with a His-tag at the N-terminal and with purity >90% as determined by SDS-PAGE.
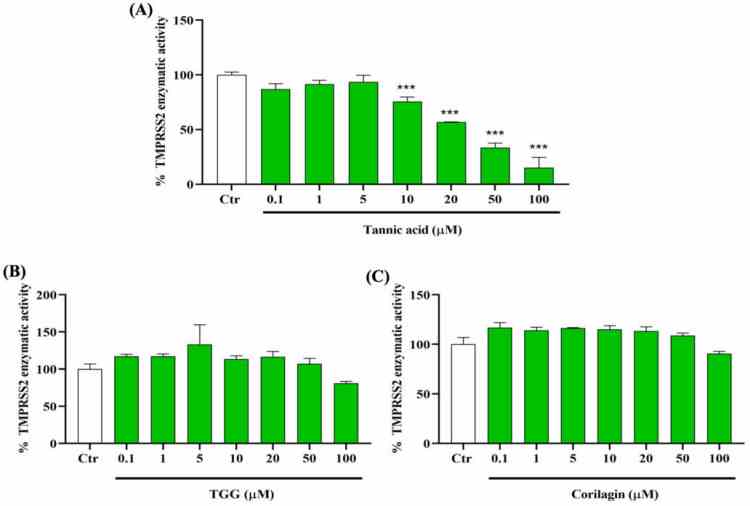
Inhibitory effects of TA, TGG, and corilagin on human transmembrane protease serine 2
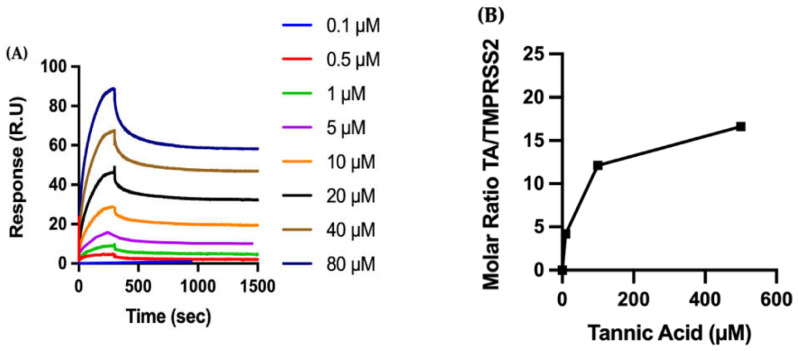
Biophysical characterization of the molecular interactions between TA and
![Binding free energy between proteins (RBD, TMPRSS2, 3CLpro) and TA for the best poses found during docking. The MD MMPBSA binding free energy is computed over the interval 750 to 1000 ns using the g\_mmpbsa tools [ 49 ].](productimages/extendimages/pmc08910432__ijms-23-02643-t001__recombinant_ascii32_human_ascii32_tmprss2_ascii32_protein__creative_ascii32_biomart.jpg)
Binding free energy between proteins (RBD,
Hesperidin Is a Potential Inhibitor against SARS-CoV-2 Infection
Journal: Nutrients PubMed ID: 34444960 Data: 2021/8/16
Authors: Fang-Ju Cheng, Thanh-Kieu Huynh, Ronan Lordan
Article Snippet:The data were normalized with the effect of tested inhibitors on the fluorescence of ACE2.The data were normalized with the effect of tested inhibitors on the fluorescence of ACE2.. In the examination of the inhibitory effects of HT and HD on protease activity of human TMPRSS2, the reaction mixture containing 15 μg/mL recombinant protein (Creative BioMart Inc., Shirley, NY, USA, Cat. No. TMPRSS2-1856H) and 60 μM HT or HD in assay buffer (25 mM Tris 8.0, 150 mM NaCl) was pre-incubated at room temperature for 30 min.. The reaction was initiated by the addition of 20 μM fluorescent protein substrate.The reaction was initiated by the addition of 20 μM fluorescent protein substrate.
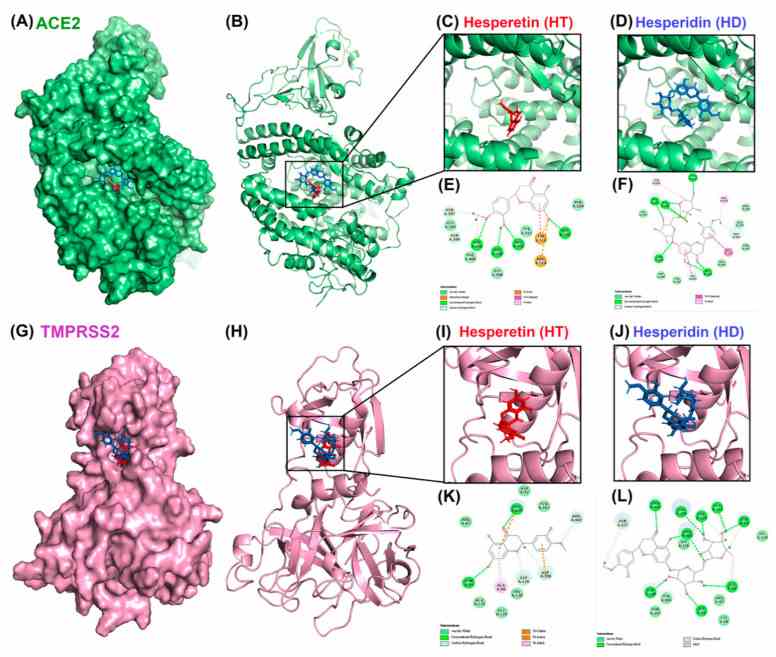
Molecular docking pose visualization for the interaction of
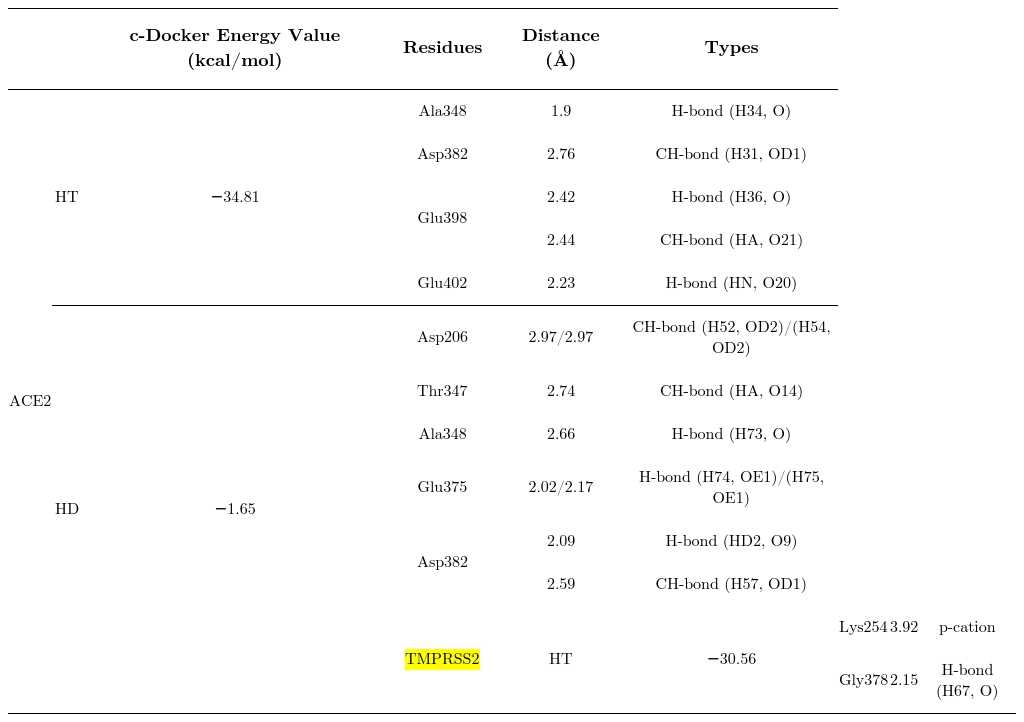
The best predicted energy values of hesperetin and hesperidin with proteins related to SARS-CoV2.
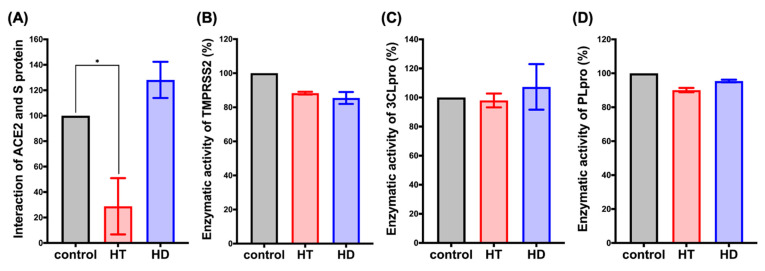
HT (Hesperetin) decreased the interaction of ACE2 and the spike protein. FRET assay was performed to determine the interaction between human receptor ACE2 and S protein ( A ). The in vitro enzymatic activity of
Phenolic compounds disrupt spike-mediated receptor-binding and entry of SARS-CoV-2 pseudo-virions
Journal: PLoS ONE PubMed ID: 34138966 Data: 2021/6/17
Authors: Anna Goc, Waldemar Sumera, Victoria Lawson
Article Snippet:All antibodies were from Santa Cruz Biotechnology (Santa Cruz, CA).All antibodies were from Santa Cruz Biotechnology (Santa Cruz, CA).. TMPRSS2 recombinant protein was from Creative BioMart (Shirley, NY).
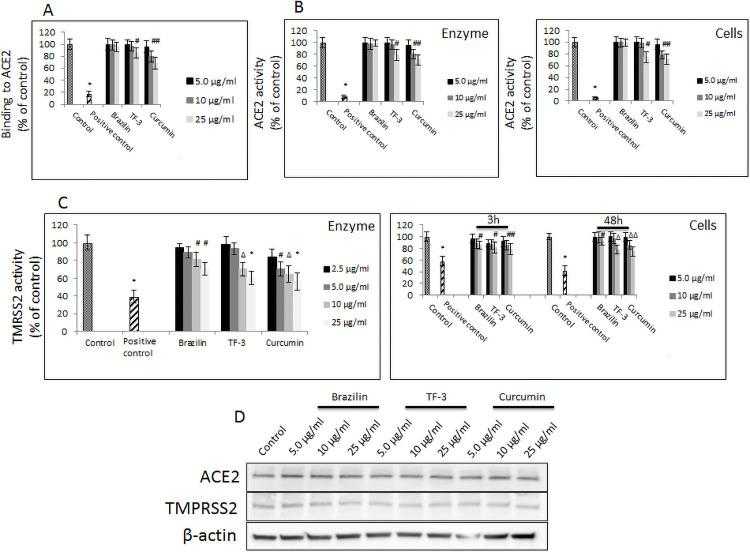
(A) Binding of indicated polyphenols at different concentrations to hACE2 receptor. Data are presented as % of control ± SD; control– 0.025% DMSO, positive control– 50% DMSO. (B) Activity of recombinant hACE2 upon treatment with indicated polyphenols at different concentrations. (left panel). Activity of cellular hACE2 upon treatment with indicated polyphenols at different concentrations. (right panel). Data are presented as % of control ± SD; * p ≤ 0.001. Control– 0.025% DMSO, positive control– 10% DMSO. (C) Activity of recombinant TMPTSS2 upon treatment with indicated polyphenols at different. (left panel). Activity of cellular TMPTSS2 upon treatment with indicated polyphenols at different concentrations (right panel). Data are presented as % of control ± SD; # p ≤ 0.05, Δ p ≤ 0.01, * p ≤ 0.001. Control– 0.025% DMSO, positive control– 50–100 μM camostat mesylate. (D) Western blot analysis of hACE2 and
Polyunsaturated ω-3 fatty acids inhibit ACE2-controlled SARS-CoV-2 binding and cellular entry
Journal: Scientific Reports PubMed ID: 33664446 Data: 2021/3/4
Authors: Anna Goc, Aleksandra Niedzwiecki, Matthias Rath
Article Snippet:To determine the inhibitory effect of selected FAs on activity of recombinant TMPRSS2 protein, 10 μM fluorogenic peptide Boc-Gln-Ala-Arg-AMC was added to linolenic acid or EPA diluted at 20–80 μg/ml concentrations.To determine the inhibitory effect of selected FAs on activity of recombinant TMPRSS2 protein, 10 μM fluorogenic peptide Boc-Gln-Ala-Arg-AMC was added to linolenic acid or EPA diluted at 20–80 μg/ml concentrations.. To this reaction 1 μM of TMPRSS2 enzyme (Creative BioMart, Shirley, NY) in assay buffer (50 mM Tris pH = 8, 150 mM NaCl) was added.. Following 1 h’s incubation at RT, detection of the fluorescent signal was done using a Tecan fluorescence spectrometer at Em/Ex = 360/440 nm (Tecan Group Ltd., Switzerland).Following 1 h’s incubation at RT, detection of the fluorescent signal was done using a Tecan fluorescence spectrometer at Em/Ex = 360/440 nm (Tecan Group Ltd., Switzerland).
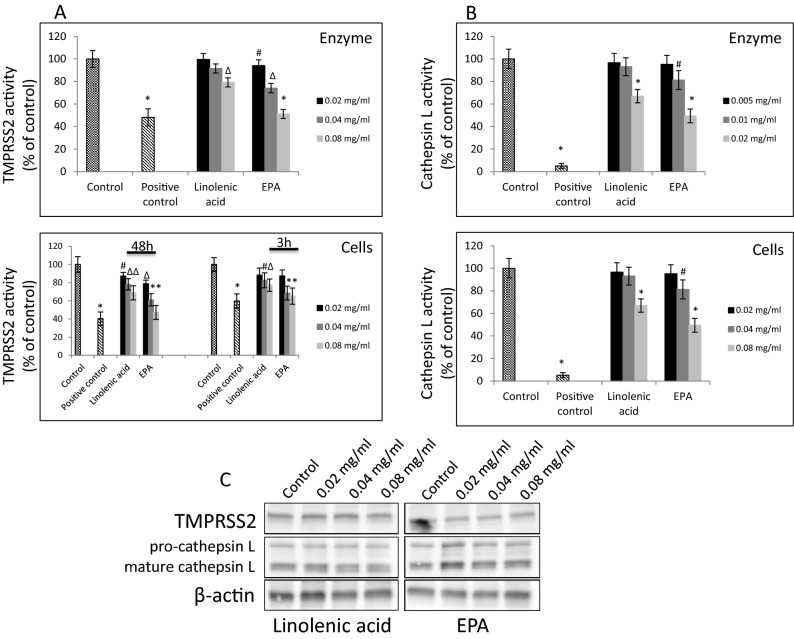
Effect of selected FAs on
An Enzymatic TMPRSS2 Assay for Assessment of Clinical Candidates and Discovery of Inhibitors as Potential Treatment of COVID-19
Journal: ACS Pharmacology & Translational Science PubMed ID: 33062952 Data: 2020/9/7
Authors: Jonathan H. Shrimp, Stephen C. Kales, Matthew D. Hall
Article Snippet:Recombinant Human TMPRSS2 protein expressed from yeast (human TMPRSS2 residues 106–492, N-terminal 6x His-tag) (cat.# TMPRSS2-1856H) was acquired from Creative BioMart (Shirley, NY).. Peptides obtained from Bachem include Boc-Leu-Gly-Arg-AMC.Peptides obtained from Bachem include Boc-Leu-Gly-Arg-AMC.
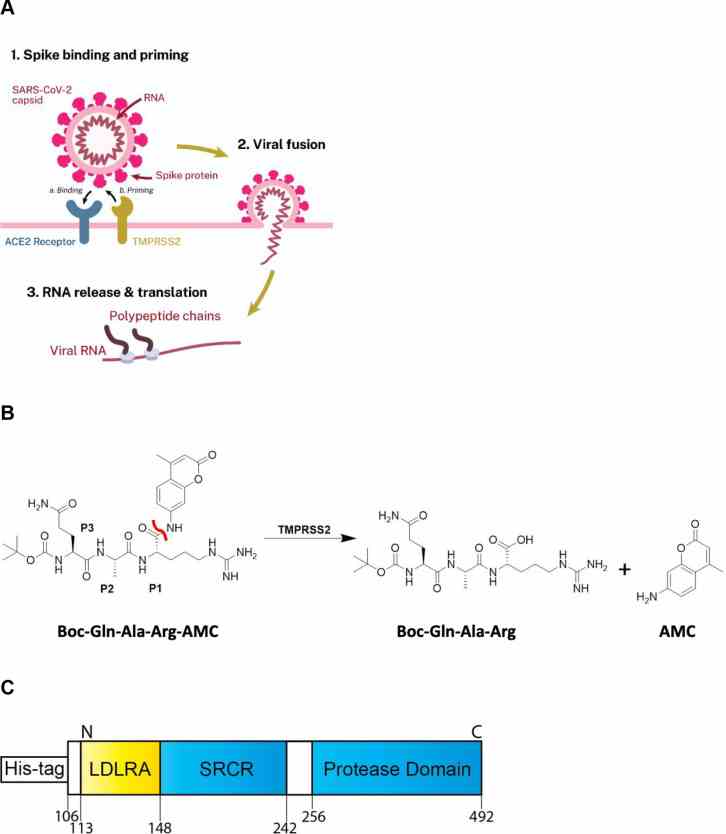
(A) Scheme demonstrating the role
![Assessment of enzymatic activity and optimization of TMPRSS2 biochemical assay. (A) Various AMC-labeled peptides. Peptide [10 μM], TMPRSS2 [1 μM] in Tris-HCl pH8. (B) TMPRSS2 titration using Boc-Gln-Ala-Arg-AMC peptide [25 μM] in Tris-HCl pH8. (C) Varying Tris-HCl buffer pH. TMPRSS2 [4 μM], Boc-Gln-Ala-Arg-AMC [25 μM]. (D) K m of Boc-Gln-Ala-Arg-AMC while TMPRSS2 [1 μM], Tris-HCl pH8. (E) 384-well plate S:B and Z ′. TMPRSS2 [1 μM], Boc-Gln-Ala-Arg-AMC [10 μM], Tris-HCl pH8. (F) 1536-well plate S:B and Z ′. TMPRSS2 [1 μM], Boc-Gln-Ala-Arg-AMC [10 μM], Tris-HCl pH8.](productimages/extendimages/pmc07507803__pt0c00106_0002.jpg)
Assessment of enzymatic activity and optimization of
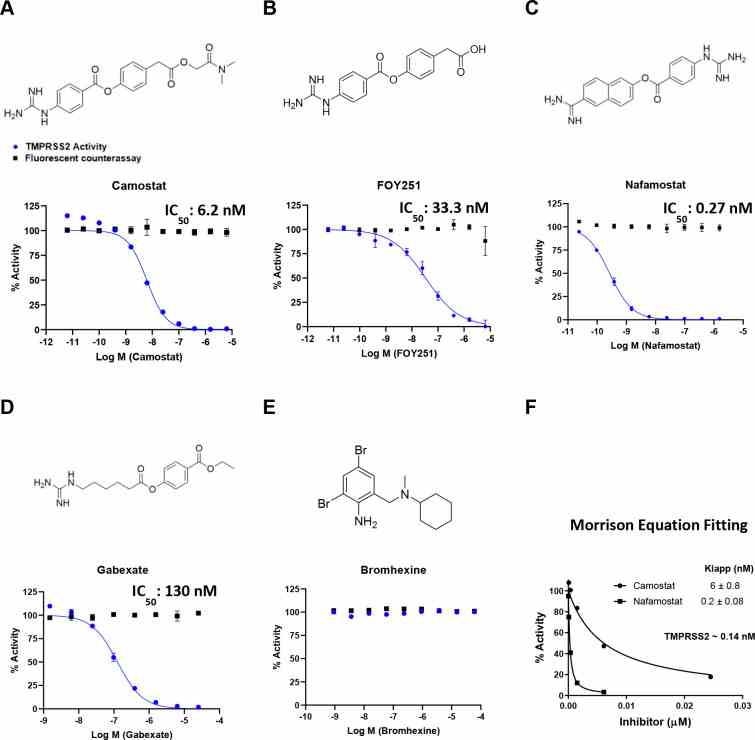
Activity of clinically-approved inhibitors against
Not For Human Consumption!
Inquiry
- Reviews (0)
- Q&As (0)


Ask a Question for All TMPRSS2 Products
Required fields are marked with *
My Review for All TMPRSS2 Products
Required fields are marked with *