


Recombinant Human DNM2, MYC/DDK-tagged
| Cat.No. : | DNM2-17H |
| Product Overview : | Recombinant Human DNM2, transcript variant 3, fused with C-terminal MYC/DDK, was expressed in HEK293 cells. |
- Specification
- Gene Information
- Related Products
- Citation
- Download
| Species : | Human |
| Source : | HEK293 |
| Tag : | DDK&Myc |
| Description : | Dynamins represent one of the subfamilies of GTP-binding proteins. These proteins share considerable sequence similarity over the N-terminal portion of the molecule, which contains the GTPase domain. Dynamins are associated with microtubules. They have been implicated in cell processes such as endocytosis and cell motility, and in alterations of the membrane that accompany certain activities such as bone resorption by osteoclasts. Dynamins bind many proteins that bind actin and other cytoskeletal proteins. Dynamins can also self-assemble, a process that stimulates GTPase activity. Five alternatively spliced transcripts encoding different proteins have been described. Additional alternatively spliced transcripts may exist, but their full-length nature has not been determined. |
| Molecular Mass : | 97.5 kDa |
| Purity : | >80% as determined by SDS-PAGE and Coomassie blue staining |
| Concentration : | >50 ug/mL as determined by microplate BCA method |
| Storage Buffer : | 25 mM Tris.HCl, pH 7.3, 100 mM glycine, 10% glycerol. |
| Gene Name | DNM2 dynamin 2 [ Homo sapiens ] |
| Official Symbol | DNM2 |
| Synonyms | DNM2; DYN2; CMT2M; DYNII; LCCS5; CMTDI1; CMTDIB; DI-CMTB; dynamin 2; dynamin-2; dynamin II; NP_001005360.1; EC 3.6.5.5; NP_001005361.1; NP_001005362.1; NP_001177645.1; NP_004936.2 |
| Gene ID | 1785 |
| mRNA Refseq | NM_004945 |
| Protein Refseq | NP_004936 |
| MIM | 602378 |
| UniProt ID | P50570 |
| Chromosome Location | 19p13.2 |
| Pathway | Adaptive Immune System; Axon guidance; Bacterial invasion of epithelial cells; Developmental Biology |
| Function | GTP binding; GTPase activity; microtubule binding |
Metastasis Suppressors NME1 and NME2 Promote Dynamin 2 Oligomerization and Regulate Tumor Cell Endocytosis, Motility and Metastasis.
Journal: Cancer research PubMed ID: 31311812 Data: 2021/7/19
Authors: Imran Khan, Brunilde Gril, Patricia S. Steeg
Article Snippet:Before co-sedimentation, human recombinant DNM2 (DNM2–18H, MYC/DDK-tagged, Creative BioMart) was centrifuged at 4°C for 15 min at 100,000x g to remove potential aggregates.. DNM2 (3.5 μg) was incubated for 15 min at 22°C in the absence or presence of NME1, NME2, NME1 P96S or NME1 H118F (1.5μg) in HCB75 buffer (20 mM HEPES, 1 mM MgCl 2 , 100 mM EGTA, 75 mM NaCl and 0.5 mM DTT) in a total volume of 25 μl.DNM2 (3.5 μg) was incubated for 15 min at 22°C in the absence or presence of NME1, NME2, NME1 P96S or NME1 H118F (1.5μg) in HCB75 buffer (20 mM HEPES, 1 mM MgCl 2 , 100 mM EGTA, 75 mM NaCl and 0.5 mM DTT) in a total volume of 25 μl.
![A Two-way co-immunoprecipitation of NME1 and DNM2 was performed on vector and NME1 overexpressing MDA-MB-231T cells using rabbit anti-NME1 and goat anti-DNM2 antibody. B Two-way co-immunoprecipitation in vector and NME1 overexpressing MDA-MB-435 cells was performed with the above antibodies. C& D Two-way co-immunoprecipitation of NME2 and DNM2 was performed on vector and NME2 overexpressing MDA-MB-231T cells using rabbit anti-NME and mouse anti-DNM2 antibodies. E Co-immunoprecipitation of NME1 and DNM2 was performed on a panel of breast cancer cell lines with varying metastatic status (low to high) using anti-NME antibody for immunoprecipitation. F DNM2 construct map showing deletion in PRD domain [Construct 1: Contains full PRD domain, Construct 2: truncated PRD domain (Δ42 amino acid), Construct 3: deleted PRD domain]. All the constructs contain PH and GED domain. G In vitro co-immunoprecipitation of NME1 was performed with DNM2 or with deletion constructs using anti-NME antibody. Data are representative of three independent experiments.](productimages/extendimages/pmc08288561__nihms-1534995-f0002.jpg)
A Two-way co-immunoprecipitation of NME1 and
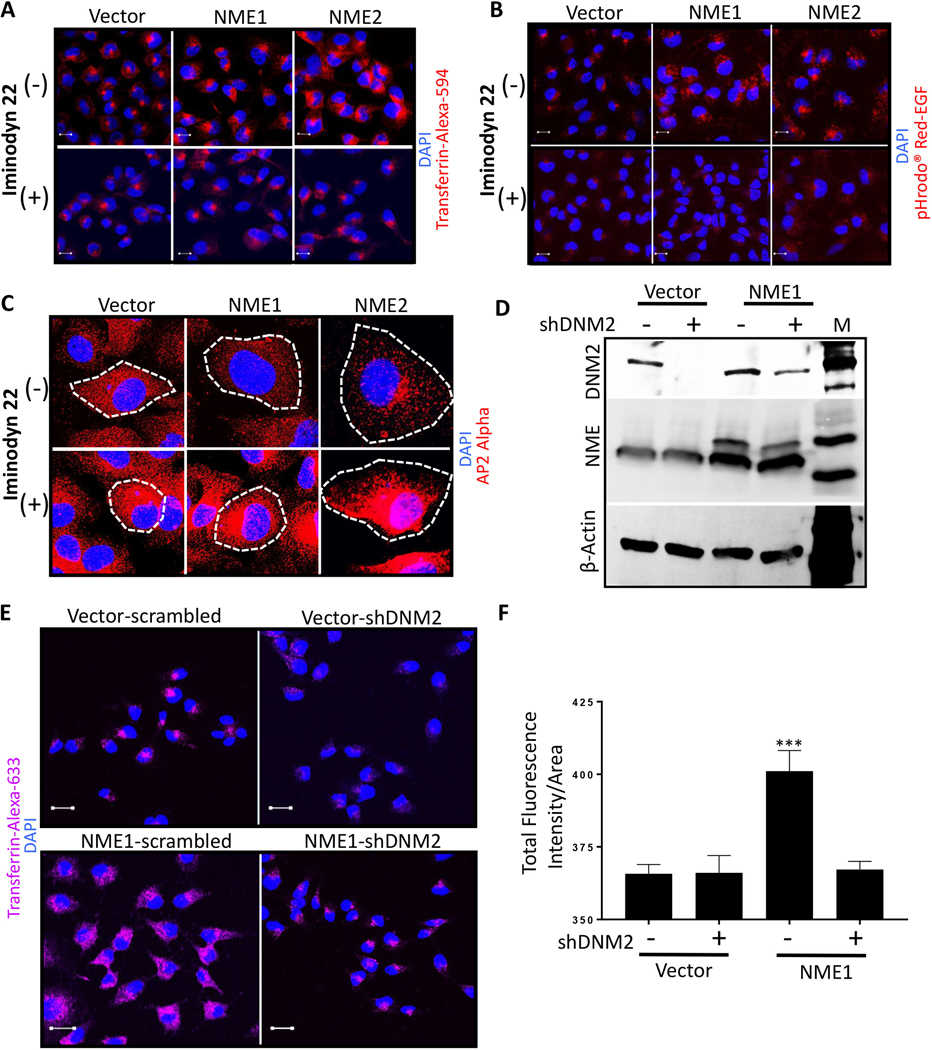
A, B Vector and NME overexpressing (NME1 and NME2) MDA-MB-231T cells were plated in chamber slides and treated with a non-cytotoxic dose (2 μM) of dynamin inhibitor (Iminodyn-22) or vehicle for 24 hrs. Cells were then incubated with Transferrin-Alexa-594 (A) or pHrodo? Red-EGF dye (B) for 15 min., fixed in PFA and nuclei stained with DAPI (blue). C Vector and NME overexpressing MDA-MB-231T cells were plated in chamber slides and cultured with and without 2 μM Iminodyn-22 for 24 hrs. Cells were then fixed in PFA and immunofluorescence was performed with AP2 alpha to detect clathrin coated pits (red). Cells are outlined by dotted lines and nuclei counterstained with DAPI. D-F Effect of
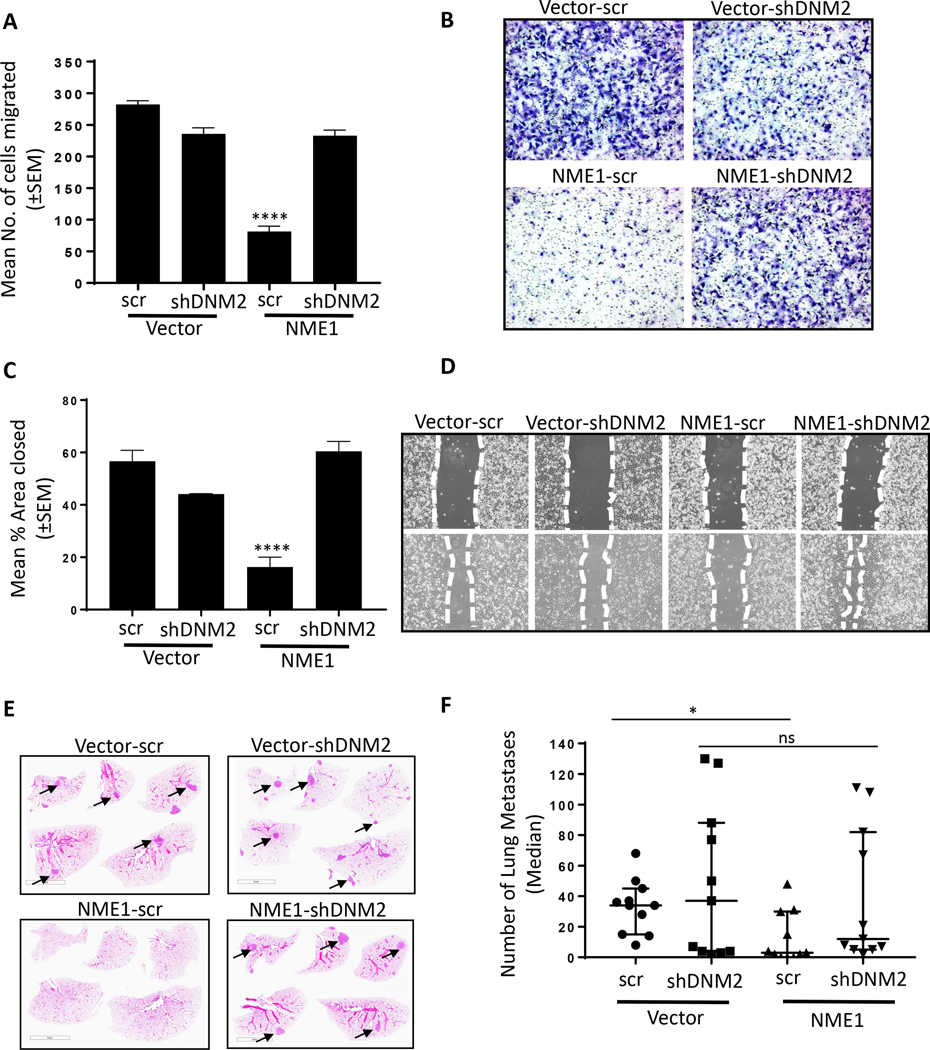
A Vector and NME transfected MDA-MB-231T cells stably transfected with scrambled or shDNM2, described in the legend to Figure 3, were assessed for motility in Boyden chambers as described in the legend to Figure 4. B Representative photographs of the Boyden chamber membrane underside showing migrated tumor cells. C Migration in scratch assays of the same cells, as described in the legend to Figure 4. D Representative photographs of the scratch invaded. E 7.5 × 10⁵ MDA-MB-231T cells expressing vector and NME1 overexpression with or without
Not For Human Consumption!
Inquiry
- Reviews (0)
- Q&As (0)


Ask a Question for All DNM2 Products
Required fields are marked with *
My Review for All DNM2 Products
Required fields are marked with *