


Recombinant Human SIRT1, GST-tagged 
| Cat.No. : | SIRT1-462H |
| Product Overview : | Recombinant Human SIRT1 (amino acids 193- 741) was expressed in anE.coliexpression system with N-terminal GST tag. MW=87.2 kDa. |
| Availability | July 28, 2026 |
| Unit | |
| Price | |
| Qty |
- Specification
- Gene Information
- Related Products
- Citation
- Download
| Species : | Human |
| Source : | E.coli |
| Tag : | GST |
| Protein Length : | 193-741 a.a. |
| Description : | Sirtuin 1 also known as NAD-dependent deacetylase sirtuin-1 is a protein that in humans is encoded by the SIRT1 gene. SIRT1 stands for sirtuin (silent mating type information regulation 2 homolog) 1 (S. cerevisiae), referring to the fact that its sirtuin homolog (biological equivalent across species) in yeast (S. cerevisiae) is Sir2. SIRT1 is an enzyme which deacetylates proteins that contribute to cellular regulation (reaction to stressors, longevity). |
| Formulated In : | 25 mM Tris-HCl, pH 8.0, 100 mM NaCl, 0.05% Tween-20 and 20% glycerol. |
| Application : | Useful for the study of enzyme kinetics, screening inhibitors, and selectivity profiling. |
| Specific Activity : | 8 pmol/min /μg. Assay condition: 25 mM Tris/Cl, pH8.0, 137 mM NaCl, 2.7 mM KCl, 1 mM MgCl2, and 0.1 mg/ml BSA, 30 μM Biomol substrate, 200 μM NAD+and 20 ng/μl Sirtuin 1. Incubation condition: 30 min at 30℃. |
| Purity : | > 80%. |
| Stability : | >6 months at –80°C. |
| Publications : |
| Gene Name | SIRT1 sirtuin (silent mating type information regulation 2 homolog) 1 (S. cerevisiae) [ Homo sapiens ] |
| Synonyms | sirtuin (silent mating type information regulation 2 homolog) 1 (S. cerevisiae); SIR2L1; SIRT1; sirtuin 1; SIR2alpha; sir2-like 1; sirtuin type 1; EC 3.5.1.-; OTTHUMP00000019691; OTTHUMP00000060745; SIR2alpha; hSIR2; hSIRT1; SIR2-like protein 1; sirtuin (silent mating type information regulation 2, S. cerevisiae, homolog) |
| Gene ID | 23411 |
| mRNA Refseq | NM_001142498 |
| Protein Refseq | NP_001135970 |
| MIM | 604479 |
| UniProt ID | Q96EB6 |
| Chromosome Location | 10q21.3 |
| Function | NAD binding; NAD+ ADP-ribosyltransferase activity; NAD-dependent histone deacetylase activity; deacetylase activity; histone binding; hydrolase activity, acting on carbon-nitrogen (but not peptide) bonds, in linear amides; identical protein binding; metal ion binding; p53 binding; protein C-terminus binding; protein domain specific binding; transcription corepressor activity; zinc ion binding |
| ◆ Recombinant Proteins | ||
| SIRT1-5771H | Recombinant Human SIRT1 Protein (Met193-Ser747), C-His tagged | +Inquiry |
| SIRT1-113H | Recombinant Human SIRT1 Protein, GST-tagged | +Inquiry |
| SIRT1-1238C | Recombinant Chicken SIRT1 | +Inquiry |
| SIRT1-30H | Recombinant Human SIRT1 Protein, GST-tagged | +Inquiry |
| SIRT1-4873H | Recombinant Human Sirtuin 1, His-tagged | +Inquiry |
| ◆ Cell & Tissue Lysates | ||
| SIRT1-595HCL | Recombinant Human SIRT1 lysate | +Inquiry |
Circular and linear: a tale of aptamer selection for the activation of SIRT1 to induce death in cancer cells
Journal: RSC Advances PubMed ID: 35516259 Data: 2020/12/21
Authors: Basma Al-Sudani, Abby H. Ragazzon-Smith, Patricia A. Ragazzon
Article Snippet:BEGM BulletKit? was purchased from Lonza.BEGM BulletKit? was purchased from Lonza.. Recombinant human SIRT1-GST-tagged [SIRT1-462H] was purchased from Creative BioMart.. PreScission Protease on-column GSTrap FF and NHS-HP SpinTrap column were purchased from GE HealthCare.PreScission Protease on-column GSTrap FF and NHS-HP SpinTrap column were purchased from GE HealthCare.
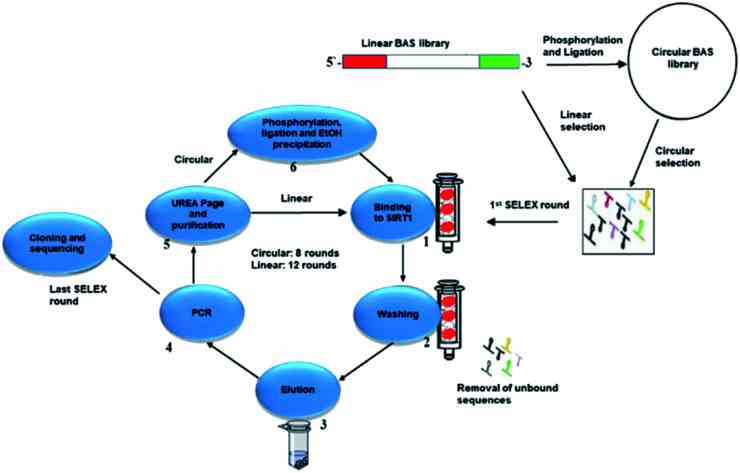
Workflow representation of the selection process. In the case of the circular library, the oligonucleotides were phosphorylated and ligated. In the case of the linear library, the oligonucleotides were unmodified. First stage of the cycle starts with the
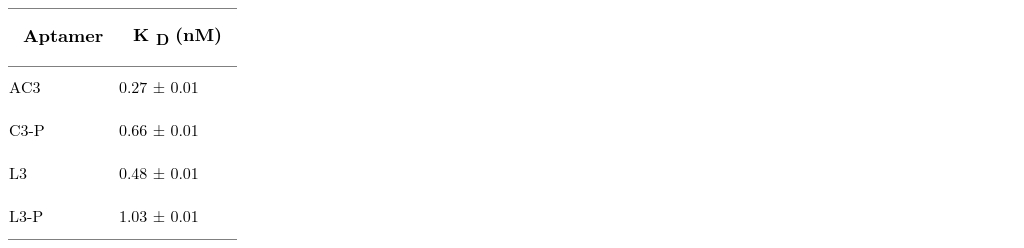
Association binding parameters resulting from the analysis of the surface plasmon resonance data for the interaction between the selected aptamers and the
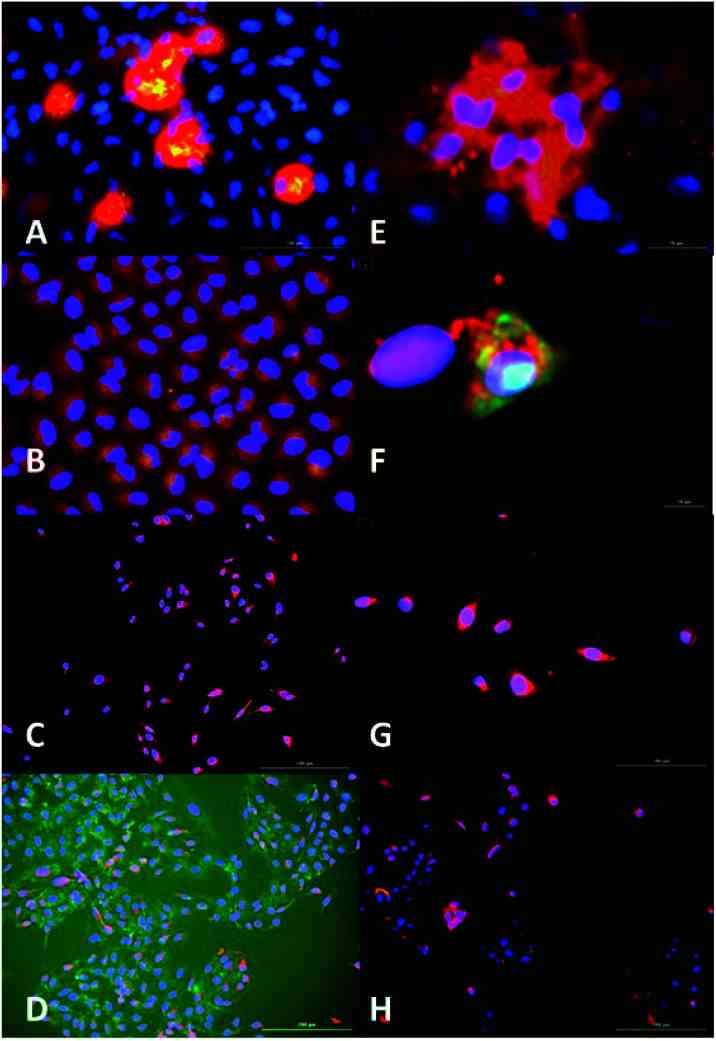
Fluorescence microscopy analysis of AC3 binding to
Not For Human Consumption!
Inquiry
- Reviews (0)
- Q&As (0)


Ask a Question for All SIRT1 Products
Required fields are marked with *
My Review for All SIRT1 Products
Required fields are marked with *