


Recombinant Human TP53
| Cat.No. : | TP53-30262TH |
| Product Overview : | p53 Mutant Human Recombinant full length protein shows a 81 kDa band on SDS-PAGE. |
- Specification
- Gene Information
- Related Products
- Citation
- Download
| Species : | Human |
| Source : | E.coli |
| Tag : | Non |
| Description : | This gene encodes tumor protein p53, which responds to diverse cellular stresses to regulate target genes that induce cell cycle arrest, apoptosis, senescence, DNA repair, or changes in metabolism. p53 protein is expressed at low level in normal cells and at a high level in a variety of transformed cell lines, where its believed to contribute to transformation and malignancy. p53 is a DNA-binding protein containing transcription activation, DNA-binding, and oligomerization domains. It is postulated to bind to a p53-binding site and activate expression of downstream genes that inhibit growth and/or invasion, and thus function as a tumor suppressor. Mutants of p53 that frequently occur in a number of different human cancers fail to bind the consensus DNA binding site, and hence cause the loss of tumor suppressor activity. Alterations of this gene occur not only as somatic mutations in human malignancies, but also as germline mutations in some cancer-prone families with Li-Fraumeni syndrome. Multiple p53 variants due to alternative promoters and multiple alternative splicing have been found. These variants encode distinct isoforms, which can regulate p53 transcriptional activity. |
| Form : | Liquid |
| Storage buffer : | Preservative: NoneConstituents: 20% Glycerol, 50mM Tris acetate, 1mM EDTA, pH 7.5 |
| Storage : | Shipped at 4°C. Upon delivery aliquot and store at -20°C or -80°C. Avoid repeated freeze / thaw cycles. |
| Full Length : | Full L. |
| Gene Name | TP53 tumor protein p53 [ Homo sapiens ] |
| Official Symbol | TP53 |
| Synonyms | TP53; tumor protein p53; cellular tumor antigen p53; LFS1; Li Fraumeni syndrome; p53; |
| Gene ID | 7157 |
| mRNA Refseq | NM_000546 |
| Protein Refseq | NP_000537 |
| MIM | 191170 |
| Uniprot ID | P04637 |
| Chromosome Location | 17p13.1 |
| Pathway | Activation of BH3-only proteins, organism-specific biosystem; Activation of NOXA and translocation to mitochondria, organism-specific biosystem; Activation of PUMA and translocation to mitochondria, organism-specific biosystem; Amyotrophic lateral sclerosis (ALS), organism-specific biosystem; Amyotrophic lateral sclerosis (ALS), conserved biosystem; |
| Function | ATP binding; DNA binding; DNA strand annealing activity; MDM2 binding; RNA polymerase II transcription factor binding; |
| ◆ Recombinant Proteins | ||
| TP53-2547H | Recombinant Human TP53 protein(301-390 aa), C-His-tagged | +Inquiry |
| TP53-6230R | Recombinant Rat TP53 Protein | +Inquiry |
| TP53-2548H | Recombinant Human TP53 protein(101-310 aa), N-MBP & C-His-tagged | +Inquiry |
| TP53-30570TH | Recombinant Human TP53, His-tagged | +Inquiry |
| TP53-06HFL | Active Recombinant Full Length Human TP53 Protein, C-Flag-tagged | +Inquiry |
| ◆ Cell & Tissue Lysates | ||
| TP53-860HCL | Recombinant Human TP53 293 Cell Lysate | +Inquiry |
c-Myc inactivation of p53 through the pan-cancer lncRNA MILIP drives cancer pathogenesis
Journal: Nature Communications PubMed ID: 33020477 Data: 2020/10/5
Authors: Yu Chen Feng, Xiao Ying Liu, Lei Jin
Article Snippet:P53 protein concentrations were measured using PathScan Total p53 Sandwich ELISA Kit (Cell Signaling Technology, Cat#7370C), and Recombinant Human TP53 protein (Creative BioMart, Cat#TP53-15H) was used as a standard.. P53 protein copies per cell were calculated according to p53 concentrations and the cell equivalents of lysate.P53 protein copies per cell were calculated according to p53 concentrations and the cell equivalents of lysate.
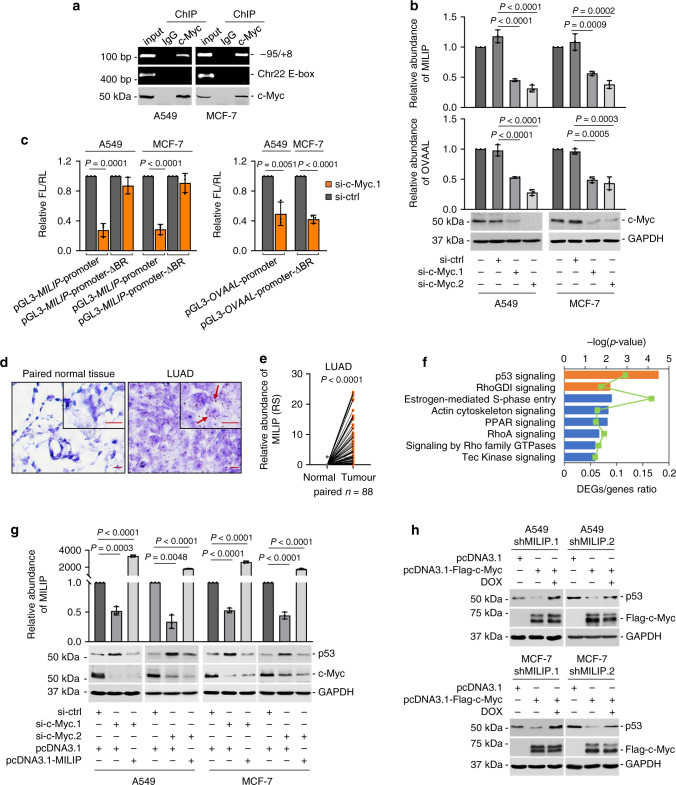
a c-Myc bound to MILIP promoter in A549 and MCF-7 cells. An E-box motif, not associated with MYC target genes on Chr22, was used as a negative control. Data shown represent three independent experiments. ChIP, chromatin immunoprecipitation. b c-Myc silencing downregulated MILIP expression in A549 and MCF-7 cells. c-Myc responsive lncRNA OVAAL was used as a positive control. Data are mean ± s.d.; n = 3 independent experiments, one-way ANOVA followed by Tukey’s multiple comparisons test. c c-Myc silencing reduced the activity of reporters with intact c-Myc binding region (BR) of MILIP promoter but not that with the c-Myc-BR deleted (ΔBR) in A549 and MCF-7 cells. Data are mean ± s.d.; n = 3 independent experiments, two-tailed Student’s t test. d Representative microscopic photographs of in situ hybridization (ISH) analysis of MILIP expression in formalin-fixed paraffin-embedded (FFPE) lung adenocarcinoma (LUAD; n = 88 biologically independent samples) compared with paired adjacent normal tissues. Scale bar, 5 μm. e Quantitation of MILIP expression as detected in ( d ) in FFPE LUAD in comparison with paired adjacent normal tissues. RS, reactive score. Two-tailed Student’s t test. f Ingenuity Pathway Analysis (IPA) of RNA-seq data showing that
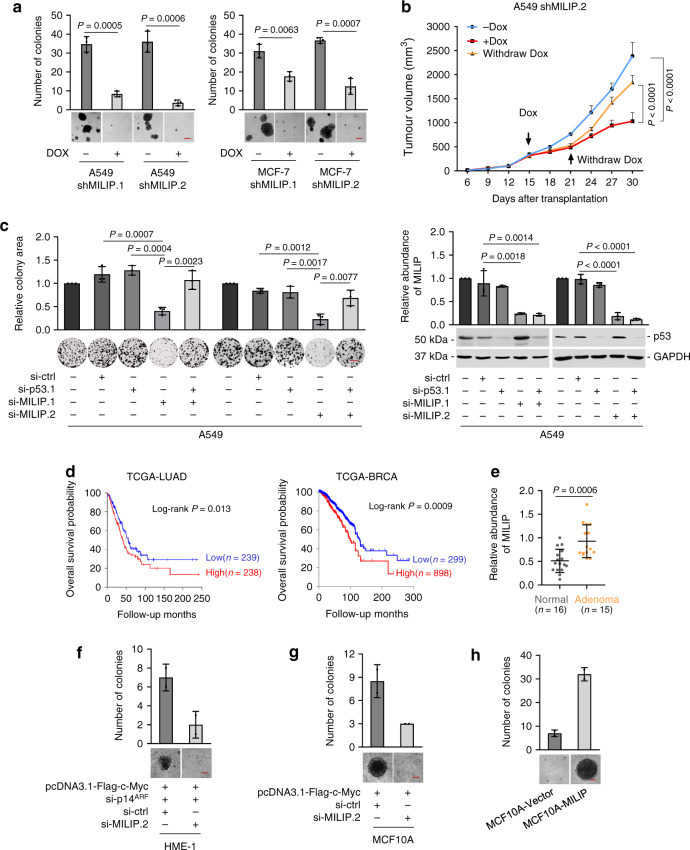
a Induced knockdown of MILIP by DOX reduced cancer cell anchorage-independent growth. Scale bar, 50 μm. Data are representatives or mean ± s.d.; n = 3 independent experiments, two-tailed Student’s t test. DOX: 200 ng/mL. b Induced knockdown of MILIP by DOX retarded A549 xenograft growth, which was reversed by DOX withdrawal in nu/nu mice. Data are mean ± s.d.; n = 6 mice per group, one-way ANOVA followed by Tukey’s multiple comparison test. DOX: 2 mg/mL supplemented with 10 mg/mL sucrose in drinking water. c MILIP silencing reduced A549 cell clonogenicity, which was attenuated by co-silencing of
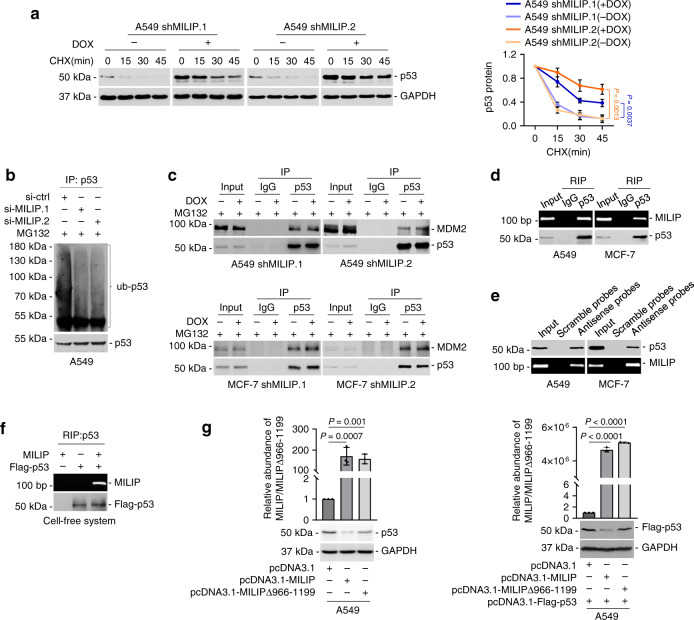
a Induced knockdown of MILIP prolonged the half-life time of
Not For Human Consumption!
Inquiry
- Reviews (0)
- Q&As (0)


Ask a Question for All TP53 Products
Required fields are marked with *
My Review for All TP53 Products
Required fields are marked with *