


Recombinant Rat Ntn1 protein, His/GST-tagged 
| Cat.No. : | Ntn1-257R |
| Product Overview : | Recombinant Rat Ntn1(Pro313~Pro565) fused with two N-terminal Tags, His-tag and GST-tag was expressed in E. coli. |
| Availability | July 29, 2026 |
| Unit | |
| Price | |
| Qty |
- Specification
- Gene Information
- Related Products
- Citation
- Download
| Species : | Rat |
| Source : | E.coli |
| Tag : | GST&His |
| Protein Length : | Pro313~Pro565 |
| Description : | Ntn1 played an important role in many functions. |
| Form : | Supplied as lyophilized form in PBS, pH7.4, containing 5% sucrose, 0.01% sarcosyl. |
| Molecular Mass : | 60.5kDa |
| AA Sequence : | PECDRCKP FHYDRPWQRA TAREANECVA CNCNLHARRC RFNMELYKLS GRKSGGVCLN CRHNTAGRHC HYCKEGFYRD MGKPITHRKA CKACDCHPVG AAGKTCNQTT GQCPCKDGVT GITCNRCAKG YQQSRSPIAP CIKIPVAPPT TAASSMEEPE DCDSYCKASK GKLKMNMKKY CRKDYAVQIH ILKADKAGDW WKFTVNIISV YKQGTSRIRR GDQSLWIRSR DIAXKCPKIK PLKKYLLLGN AEDSP |
| Endotoxin : | <1.0EU per 1µg (determined by the LAL method) |
| Purity : | > 90% |
| Applications : | SDS-PAGE; WB; ELISA; IP. |
| Storage : | Avoid repeated freeze/thaw cycles. Store at 2-8 centigrade for one month. Aliquot and store at -80 centigrade for 12 months. |
| Reconstitution : | Reconstitute in sterile PBS, pH7.2-pH7.4. |
| Publications : |
|
| Gene Name | Ntn1 netrin 1 [ Rattus norvegicus ] |
| Official Symbol | Ntn1 |
| Synonyms | NTN1; netrin 1; netrin-1; |
| Gene ID | 114523 |
| mRNA Refseq | NM_053731 |
| Protein Refseq | NP_446183 |
| MIM | |
| UniProt ID | |
| Chromosome Location | 10q24 |
| Pathway | Alpha6-Beta4 Integrin Signaling Pathway, organism-specific biosystem; Axon guidance, organism-specific biosystem; Axon guidance, conserved biosystem; Axon guidance, organism-specific biosystem; Axon guidance, organism-specific biosystem; Cell-Cell communication, organism-specific biosystem; DCC mediated attractive signaling, organism-specific biosystem; |
| ◆ Recombinant Proteins | ||
| Ntn1-017H | Recombinant Mouse Netrin 1 Protein, Flag tagged | +Inquiry |
| Ntn1-4442R | Recombinant Rat Ntn1 protein, His-tagged | +Inquiry |
| Ntn1-257R | Recombinant Rat Ntn1 protein, His/GST-tagged | +Inquiry |
| NTN1-428H | Active Recombinant Human NTN1, Fc-tagged | +Inquiry |
| NTN1-018H | Recombinant Human/Mouse/Rat Netrin 1 Protein, Fc tagged | +Inquiry |
The Role of Netrin-1 in Improving Functional Recovery through Autophagy Stimulation Following Spinal Cord Injury in Rats
Journal: Frontiers in Cellular Neuroscience PubMed ID: 29209172 Data: 2017/11/3
Authors: Liangjie Bai, Xifan Mei, Gang Lv
Article Snippet:Recombinant rat Netrin-1 (Creative BioMart, Shirley, NY, USA) was dissolved in 1× phosphate-buffered saline (PBS) to achieve a final concentration of 800 ng/mL.. Compound C (Selleck Chemicals LLC, USA) was dissolved in 1× PBS and administered at a dose of 20 mg/kg (Bai et al., ).Compound C (Selleck Chemicals LLC, USA) was dissolved in 1× PBS and administered at a dose of 20 mg/kg (Bai et al., ).
Netrin-1 Improves Functional Recovery through Autophagy Regulation by Activating the AMPK/mTOR Signaling Pathway in Rats with Spinal Cord Injury
Journal: Scientific Reports PubMed ID: 28186165 Data: 2017/2/10
Authors: Liangjie Bai, Xifan Mei, Gang Lv
Article Snippet:Recombinant rat Netrin-1 was purchased from Creative BioMart (Shirley, NY, USA).. Anti-LC3B, anti-Beclin-1, anti-NeuN, anti-mTOR, and anti-p-mTOR antibody as well as goat anti-rabbit and goat anti-mouse-IgG HRP were purchased from Abcam (Cambridge, MA, USA).Anti-LC3B, anti-Beclin-1, anti-NeuN, anti-mTOR, and anti-p-mTOR antibody as well as goat anti-rabbit and goat anti-mouse-IgG HRP were purchased from Abcam (Cambridge, MA, USA).
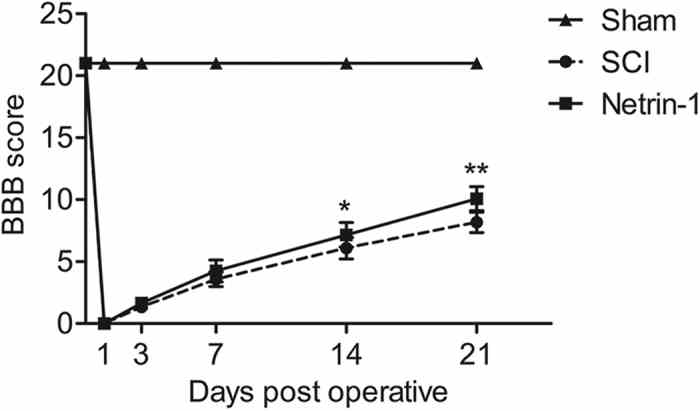
BBB scores of the sham, SCI, and
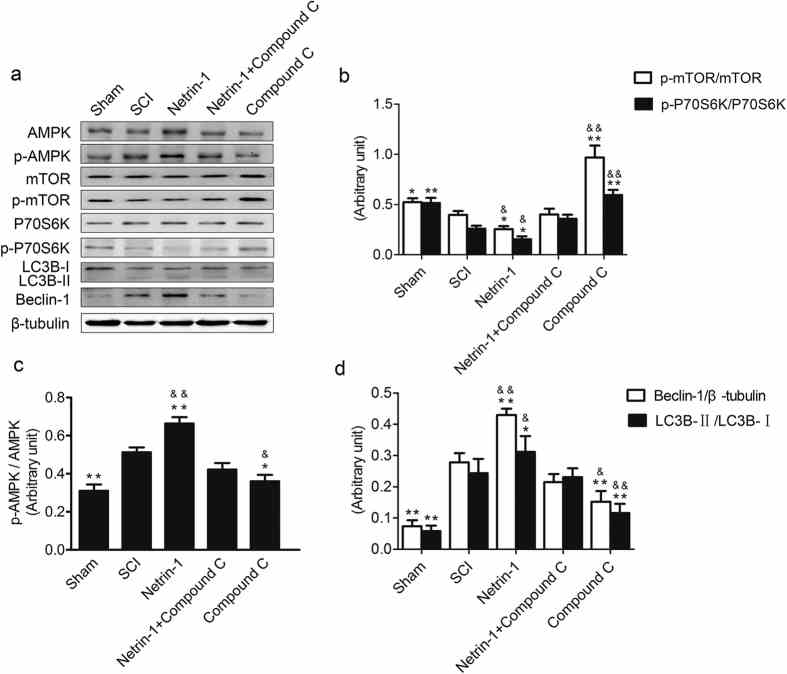
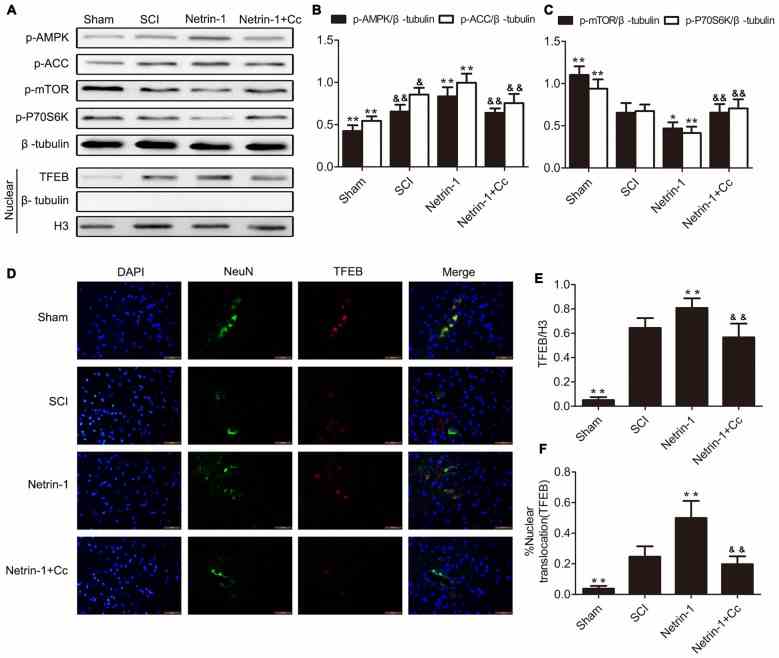
(a) Expression of AMPK, p-AMPK, mTOR, p-mTOR, p-P70S6K, P70S6K, Beclin-1, LC3B, and β-tubulin in the sham, SCI,
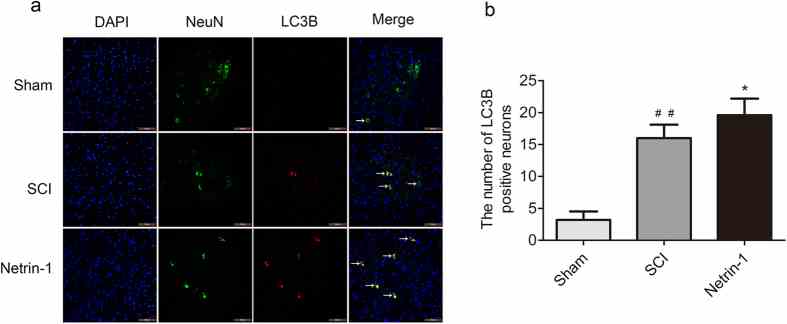
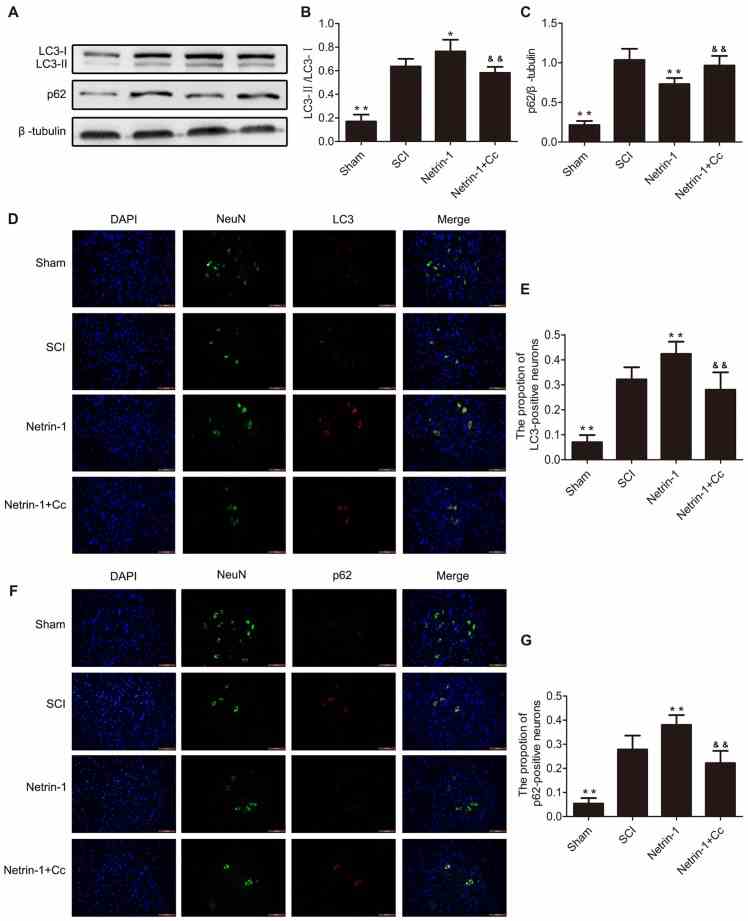
(a) Double staining for NeuN (green)/LC3B (red) of sections from the spinal cord sample in the sham, SCI, and
Not For Human Consumption!
Inquiry
- Reviews (0)
- Q&As (0)


Ask a Question for All Ntn1 Products
Required fields are marked with *
My Review for All Ntn1 Products
Required fields are marked with *