


Human Transferrin
| Cat.No. : | TF-4777H |
| Product Overview : | Product is the lyophilized powder of human TF and buffer salts. Human TF is purified from pooled human serum using multi-step procedures which may include salt fractionation, gel filtration, ion-exchange chromatography and immunoabsorption. The product is dialyzed into 0.01M sodium phosphate, 0.07M sodium chloride, pH 7.3, filtered through a 0.22 µm filter, vialed and lyophilized. No preservative has been added. |
- Specification
- Gene Information
- Related Products
- Citation
- Download
| Species : | Human |
| Source : | Human Plasma |
| Tag : | Non |
| Description : | TF is a glycoprotein that binds iron very tightly but reversibly. Although iron bound to transferrin is less than 0.1% (4 mg) of the total body iron, it is the most important iron pool, with the highest rate of turnover (25 mg/24 h). TF has a molecular weight of around 80 kDa and contains 2 specific high-affinity Fe (III) binding sites. |
| Preparation : | The protein is purified from pooled human plasma and lyophilized from 0.02M NH4HCO3. |
| Reconstitution : | The protein is readily soluble at 1% in deionised. Alternatively, it can be reconstituted with a neutral buffer, such as PBS. |
| SDS-PAGE : | The preparation shows a tight cluster of bands with a molecular weight of 77 kDa. Dimers may appear under certan conditions. |
| Protein : | 98% (By Lowry) |
| Purity : | > 98 % (By Cellulose Acetate Electrophoresis) |
| Iron : | 27.85 µg/g (By Atomic Absorption). 1 gm transferrin can bind approximately 1400-1500 µg of iron. |
| pH : | 7.24 (3% solution) |
| Endotoxin Level : | 0.034 EU/mg (By Limulus Amebocyte Lysate) |
| Microbial detection : | No Mycoplasma is detected and Bioburden is less than 10 cfu/ml. |
| Moisture : | 0.9 % (By Loss on Drying) |
| Storage : | Store at -10°C or below. |
| Pathways : | EPHB forward signaling; Formation of Platelet plug; HIF-1-alpha transcription factor network; Hemostasis; Iron uptake and transport; Mineral absorption; Platelet Activation; Platelet degranulation; Response to elevated platelet cytosolic Ca2+; Transferrin endocytosis and recycling; Transmembrane transport of small molecules |
| Gene Name | TF transferrin [ Homo sapiens ] |
| Official Symbol | TF |
| Synonyms | TF; transferring; PRO1557; PRO2086; DKFZp781D0156; serotransferrin; siderophilin; OTTHUMP00000197155; beta-1 metal-binding globulin; Serotransferrin; Beta-1 metal-binding globulin; Siderophilin |
| Gene ID | 7018 |
| mRNA Refseq | NM_001063 |
| Protein Refseq | NP_001054 |
| MIM | 190000 |
| UniProt ID | P02787 |
| Chromosome Location | 3q21 |
| Function | ferric iron binding; metal ion binding; protein binding; ubiquitin protein ligase binding |
| ◆ Recombinant Proteins | ||
| Tf-151R | Recombinant Rat Tf Protein, His-tagged | +Inquiry |
| TF-551H | Recombinant Human TF Protein, His-tagged | +Inquiry |
| TF-393HFL | Recombinant Full Length Human TF Protein, C-Flag-tagged | +Inquiry |
| TF-5682R | Recombinant Rat TF Protein, His (Fc)-Avi-tagged | +Inquiry |
| TF-03H | Recombinant Human Transferrin | +Inquiry |
| ◆ Native Proteins | ||
| TF-103H | Native Human Apotransferrin | +Inquiry |
| TF-135R | Native Rabbit Transferrin | +Inquiry |
| TF-93R | Native Rat Transferrin | +Inquiry |
| TF-172S | Native Sheep transferrin | +Inquiry |
| TF-31156TH | Native Human TF | +Inquiry |
| ◆ Cell & Tissue Lysates | ||
| TF-1554SCL | Recombinant Sus scrofa (Pig) TF cell lysate | +Inquiry |
| TF-1208MCL | Recombinant Mouse TF cell lysate | +Inquiry |
| TF-2542HCL | Recombinant Human TF cell lysate | +Inquiry |
| TF-001RCL | Recombinant Rat TF cell lysate | +Inquiry |
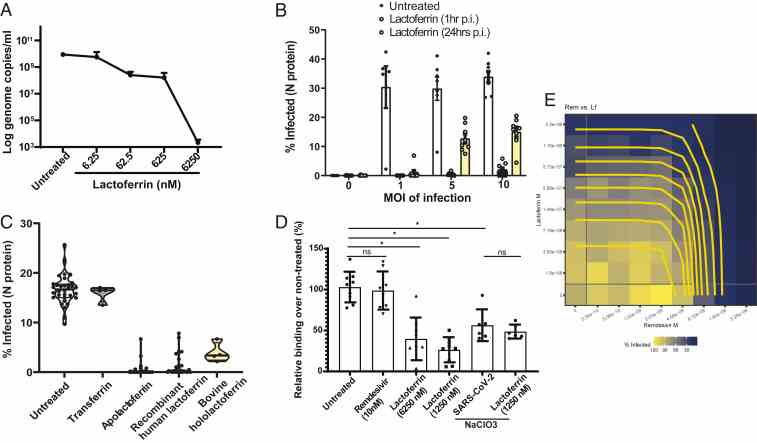
Morphological cell profiling of SARS-CoV-2 infection identifies drug repurposing candidates for COVID-19
Journal: Proceedings of the National Academy of Sciences of the United States of America PubMed ID: 34413211 Data: 2021/9/7
Authors: Carmen Mirabelli, Jesse W. Wotring, Jonathan Z. Sexton
Article Snippet:The library was formatted in five 384-well compound plates and was dissolved in DMSO at 10 mM.The library was formatted in five 384-well compound plates and was dissolved in DMSO at 10 mM.. Apolactoferrin was provided by Glanbia Nutritionals (Bioferrin 2000); Hololactoferrin (Sigma-Aldrich; L4765), native human lactoferrin (Creative BioMart; LFT-8196H), and transferrin (Sigma-Aldrich; T2036) were handled separately and added manually in cell culture media.. Dilution plates were generated for qHTS at concentrations of 2 mM, 1 mM, 500 μM, 250 μM, and 50 μM, and compounds were dispensed at 1:1,000 dilution.Dilution plates were generated for qHTS at concentrations of 2 mM, 1 mM, 500 μM, 250 μM, and 50 μM, and compounds were dispensed at 1:1,000 dilution.
Not For Human Consumption!
Inquiry
- Reviews (0)
- Q&As (0)


Ask a Question for All TF Products
Required fields are marked with *
My Review for All TF Products
Required fields are marked with *