


Guide for Mass Spectrometric Identification of Phosphorylated Peptides and Phosphorylated Sites
After enrichment of phosphorylated protein or phosphorylated peptide, the name of phosphorylated protein can be determined only after further analysis by mass spectrometry or chemical degradation. The development of mass spectrometry technology provides new ideas for the identification of phosphorylated proteins. Mass spectrometric detection is mainly accomplished by the combination of ion source and detector. Ion sources mainly include spray (ESI) and matrix-assisted laser desorption/ionization (MALDI). There are many kinds of detectors, such as three-stage four-stage rod, ion trap, time-of-flight detector and TOF (time-of-flight)-TOF. The analysis of phosphorylation sites is one of the difficulties in phosphorylation analysis. At present, it is mainly obtained by using the fragment information of relevant peptide segments obtained from the mass spectrometry, and using some algorithms to compare and score the mass spectra of fragment ions with the database. The main method is CID (collision-induced dissociation) fragment analysis, that is, introducing inert gas to smash peptide ions to obtain relevant information.
This section mainly combines MALDI and TOF-TOF to detect and analyze phosphorylated peptides and phosphorylated sites.
This experimental manual aims to help scientific researchers master the basic principles and main steps of mass spectrometry identification of phosphorylated peptides and phosphorylated sites, and understand the methods and applications of mass spectrometry identification of phosphorylated peptides and phosphorylated sites.
MALDI and TOF-TOF technologies can determine phosphorylated peptides and phosphorylated sites after two analyses by primary mass spectrometry combined with tandem secondary mass spectrometry. After enzymolysis, the protein is sent to the mass spectrometer to obtain the primary mass spectrum. The ions in the MALDI mass spectrum generally carry only one charge. The algorithm for identifying protein from the primary mass spectrum (mass stripe) is mainly used on the mass spectrum generated by MALDI-TOF. Select the parent ion with strong signal from the ions dissociated by the primary mass spectrometry, and after the second collision activation, produce the low-energy collision-induced decomposition product (secondary sub-ion), which can obtain more comprehensive secondary ion information. A mass spectrum peak with a difference of 80 (HPO3=80) from the theoretical value of the relative molecular weight of the peptide segment can be found in the primary mass spectrum. If the parent ion in the secondary mass spectrum of the mass spectrum peak is 98 (neutral loss, H3PO4=98) from the next highest intensity mass spectrum peak, the peptide segment can be determined as a phosphorylated peptide segment, and the specific phosphorylation site can be further confirmed by the secondary or multistage mass spectrum.
1. Main Instruments and Equipment
9800-MALDI-TOF-TOF mass spectrometer, electric spray quadrupole orthogonal acceleration time of flight tandem mass spectrometer, Q-TOF2 electric spray mass spectrometer (equipped with capillary liquid chromatography and nano lift spray source).
2. Material
Phosphorylated proteolytic products.
3. Main reagents
(1) Calibration sample. Dissolve with 30% acetonitrile 0.01% TFA solution.
(2) Substrate
| 5mmol/L | CHCA |
| 70% | Acetonitrile |
| 0.1% | TFA |
1. Identification and analysis of phosphorpeptides by mass spectrometry (9800-MALDI-TOF-TOF mass spectrometer)
(1) Mix the enzymatic digestion product with 1 μL of 5 mg/mL CHCA and spot onto a clean and dry MALDI sample target.
(2) Power on.
(3) Open the software.
(4) Point the sample and Cal Mix on the upper sample target.
(5) Enter the sample target.
(6) The primary mass spectrometric analysis method and the secondary mass spectrometric analysis method were established.
(7) The mass spectrometer began to analyze the enzymatic fragments.
(8) Use GPS explorerTM software to identify the results obtained by mass spectrometer and determine the protein name.
Through MALDI-TOF/TOF primary mass spectrometry, a mass spectrum peak with a difference of 80 (HPO3=80) from the theoretical value of the relative molecular weight of the peptide segment can be found (Figure 7-7-1). If the mass spectrum peak of the secondary mass spectrum of this peak is 98 (neutral loss, H3PO4=98) from the next highest intensity mass spectrum peak, the peptide segment can be determined as a phosphorylated peptide segment (Figure 7-7-2).
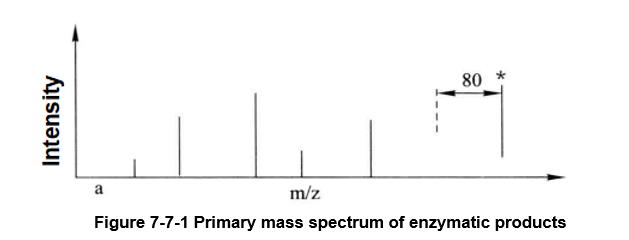 Figure 7-7-1 Primary mass spectrum of enzymatic products
The mass spectrum peak of the phosphorylated peptide segment is marked with an asterisk, and its theoretical relative molecular mass shift to the unphosphorylated peptide segment is 80 (HPO3=80)
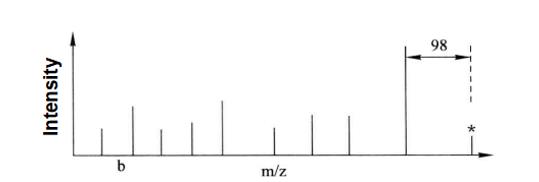 Figure 7-7-2 Secondary mass spectrum analysis of the mass spectrum peak marked with star in the above figure
In the figure, we can see that the neutral deletion peak is 98 (H3PO4=98) less than the relative molecular weight of the parent ion
2. Mass spectrometric identification of phosphorylation sites for analysis
An electrospray quadrupole orthogonal accelerated time-of-flight tandem mass spectrometer and a Q-TOF2 electrospray mass spectrometer (equipped with capillary liquid chromatography and a nanoliter spray source) from Micromass were used.
(1) Sample preparation
1μL 1μg/μL β-casein enzyme digestion mixture was diluted to 100μL (about 500 fmol/μL) with 50% acetonitrile/water solution.
(2) Turn on the machine and commission the machine
The machine source temperature was 80°C and the cone well voltage was about 50 V. The TOF acceleration voltage was 9.1 kV. the MCP detector voltage was 2200 V. For manual sequencing, a capillary voltage of 800-1200 V was used to obtain a stable spray.
(3) Sample injection from syringe pump
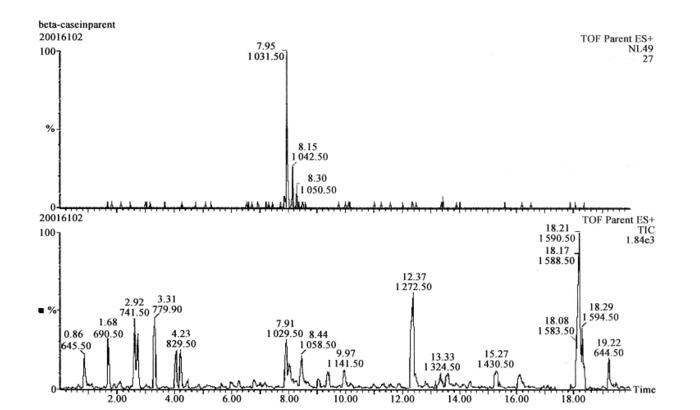 Figure 7-7-3 The upper half is the ion flow chromatogram of the neutral loss 49 scan, and the lower half is the total ion flow chromatogram of the scan
The peptide shown in the upper panel is the phosphorylated peptide obtained from the scan, which is consistent with the mass-to-charge ratio of the phosphorylated peptide obtained from the theoretical enzymatic cleavage of β-casein. The mass spectra were processed by the special software MaxEnt3, and then the peptide sequences could be directly deduced by the special software MasSeq.
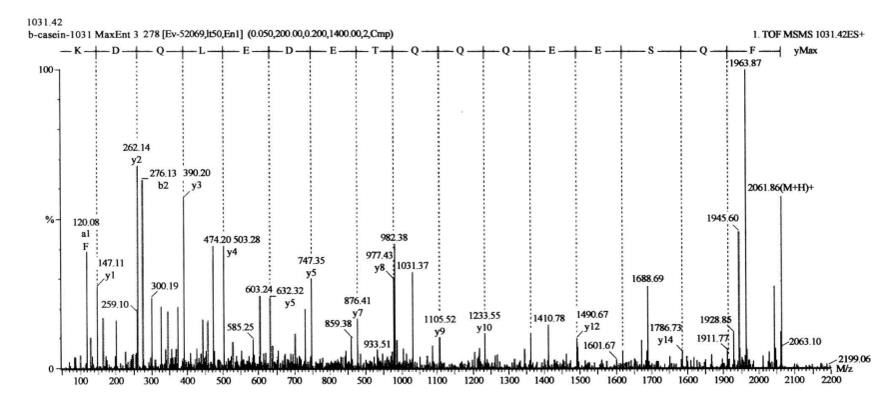
The sequence of the phosphorylated peptide was obtained by switching the instrument to positive ion MS/MS mode and selecting ion 1031.50 for tandem mass spectrometry analysis (Figure 7-7-4): FQSEEQQQTEDELQDK, where S is the phosphorylated serine.
1. High-purity proteolytic products help to obtain good results of mass spectrometry analysis.
2. Phosphorylated peptides and sites should be analyzed with attention to the selection of appropriate parameters for detection