


Active Recombinant Human JAG1 protein, Fc-tagged 

| Cat.No. : | JAG1-3138H |
| Product Overview : | Active Recombinant Human JAG1 protein(NP_000205.1)(Met 1-Ser 1046) was expressed in HEK293, fused with Fc region of human IgG1 at the C-terminus. |
| Availability | July 29, 2026 |
| Unit | |
| Price | |
| Qty |
- Specification
- Gene Information
- Related Products
- Citation
- Download
| Species : | Human |
| Source : | HEK293 |
| Tag : | Fc |
| Protein Length : | 1-1046 aa |
| Form : | Lyophilized from sterile PBS, pH 7.4. |
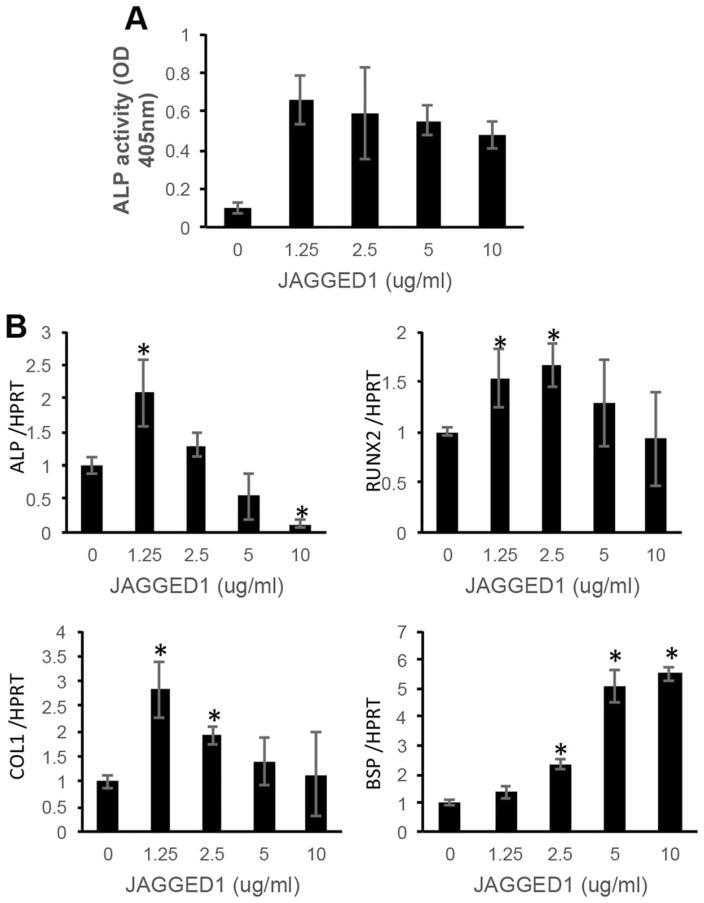
| Bio-activity : | Measured by the ability of the immobilized protein to enhance BMP2 induced alkaline phosphatase activity in C3H10T1/2 mouse embryonic fibroblast cells. The ED50 for this effect is typically 5-30 μg/mL. |
| Molecular Mass : | The recombinant human JAG1/Fc is a disulfide-linked homodimer. The reduced monomer consists of 1254 amino acids and has a predicted molecular mass of 137 kDa. In SDS-PAGE under reducing conditions, the apparent molecular mass of rh JAG1/Fc monomer is approximately 180-200 kDa due to glycosylation. |
| Endotoxin : | < 1.0 EU per μg of the protein as determined by the LAL method. |
| Purity : | > 85 % as determined by SDS-PAGE |
| Storage : | Store it under sterile conditions at -20°C to -80°C upon receiving. Recommend to aliquot the protein into smaller quantities for optimal storage. Avoid repeated freeze-thaw cycles. |
| Reconstitution : | It is recommended that sterile water be added to the vial to prepare a stock solution of 0.2 ug/ul. Centrifuge the vial at 4°C before opening to recover the entire contents. |
| Publications : |
|
| Gene Name | JAG1 jagged 1 [ Homo sapiens ] |
| Official Symbol | JAG1 |
| Synonyms | JAG1; jagged 1; AGS, Alagille syndrome, JAGL1; protein jagged-1; AHD; AWS; CD339; HJ1; AGS; JAGL1; MGC104644; |
| Gene ID | 182 |
| mRNA Refseq | NM_000214 |
| Protein Refseq | NP_000205 |
| UniProt ID | P78504 |
| ◆ Recombinant Proteins | ||
| Jag1-12R | Active Recombinant Rat Jag1 Protein (Ser32-Asp1067), C-6×His-tagged | +Inquiry |
| JAG1-1762R | Recombinant Rhesus Monkey JAG1 Protein, hIgG1-tagged | +Inquiry |
| JAG1-2348H | Recombinant Human JAG1 Protein, His-tagged | +Inquiry |
| JAG1-7436H | Recombinant Human JAG1 protein, His-tagged | +Inquiry |
| Jag1-381M | Active Recombinant Mouse Jag1, Fc-tagged | +Inquiry |
| ◆ Cell & Tissue Lysates | ||
| JAG1-2382HCL | Recombinant Human JAG1 cell lysate | +Inquiry |
JAGGED1 Stimulates Cranial Neural Crest Cell Osteoblast Commitment Pathways and Bone Regeneration Independent of Canonical NOTCH Signaling
Journal: Bone PubMed ID: 32980561 Data: 2022/4/24
Authors: Archana Kamalakar, Jay M. McKinney, Steven L. Goudy
Article Snippet:50 μL (1.5 mg) of Dynabeads Protein G ( 36 ) (Invitrogen 10003D) were transferred to a tube, where the beads were separated from the solution using a magnet.50 μL (1.5 mg) of Dynabeads Protein G ( 36 ) (Invitrogen 10003D) were transferred to a tube, where the beads were separated from the solution using a magnet.. Recombinant JAG1-Fc (5 μM, 5.7 μM, 10 μM or 20 μM) (Creative BioMart, JAG1–3138H) and IgG-Fc fragment (5 μM or 5.7 μM) (Abcam, ab90285) alone were diluted in 200 μL PBS with 0.1% Tween-20 (Fisher, BP337–500) and then added to the dynabeads.. The beads plus proteins were incubated at 4°C with rotation for 16 hours.The beads plus proteins were incubated at 4°C with rotation for 16 hours.
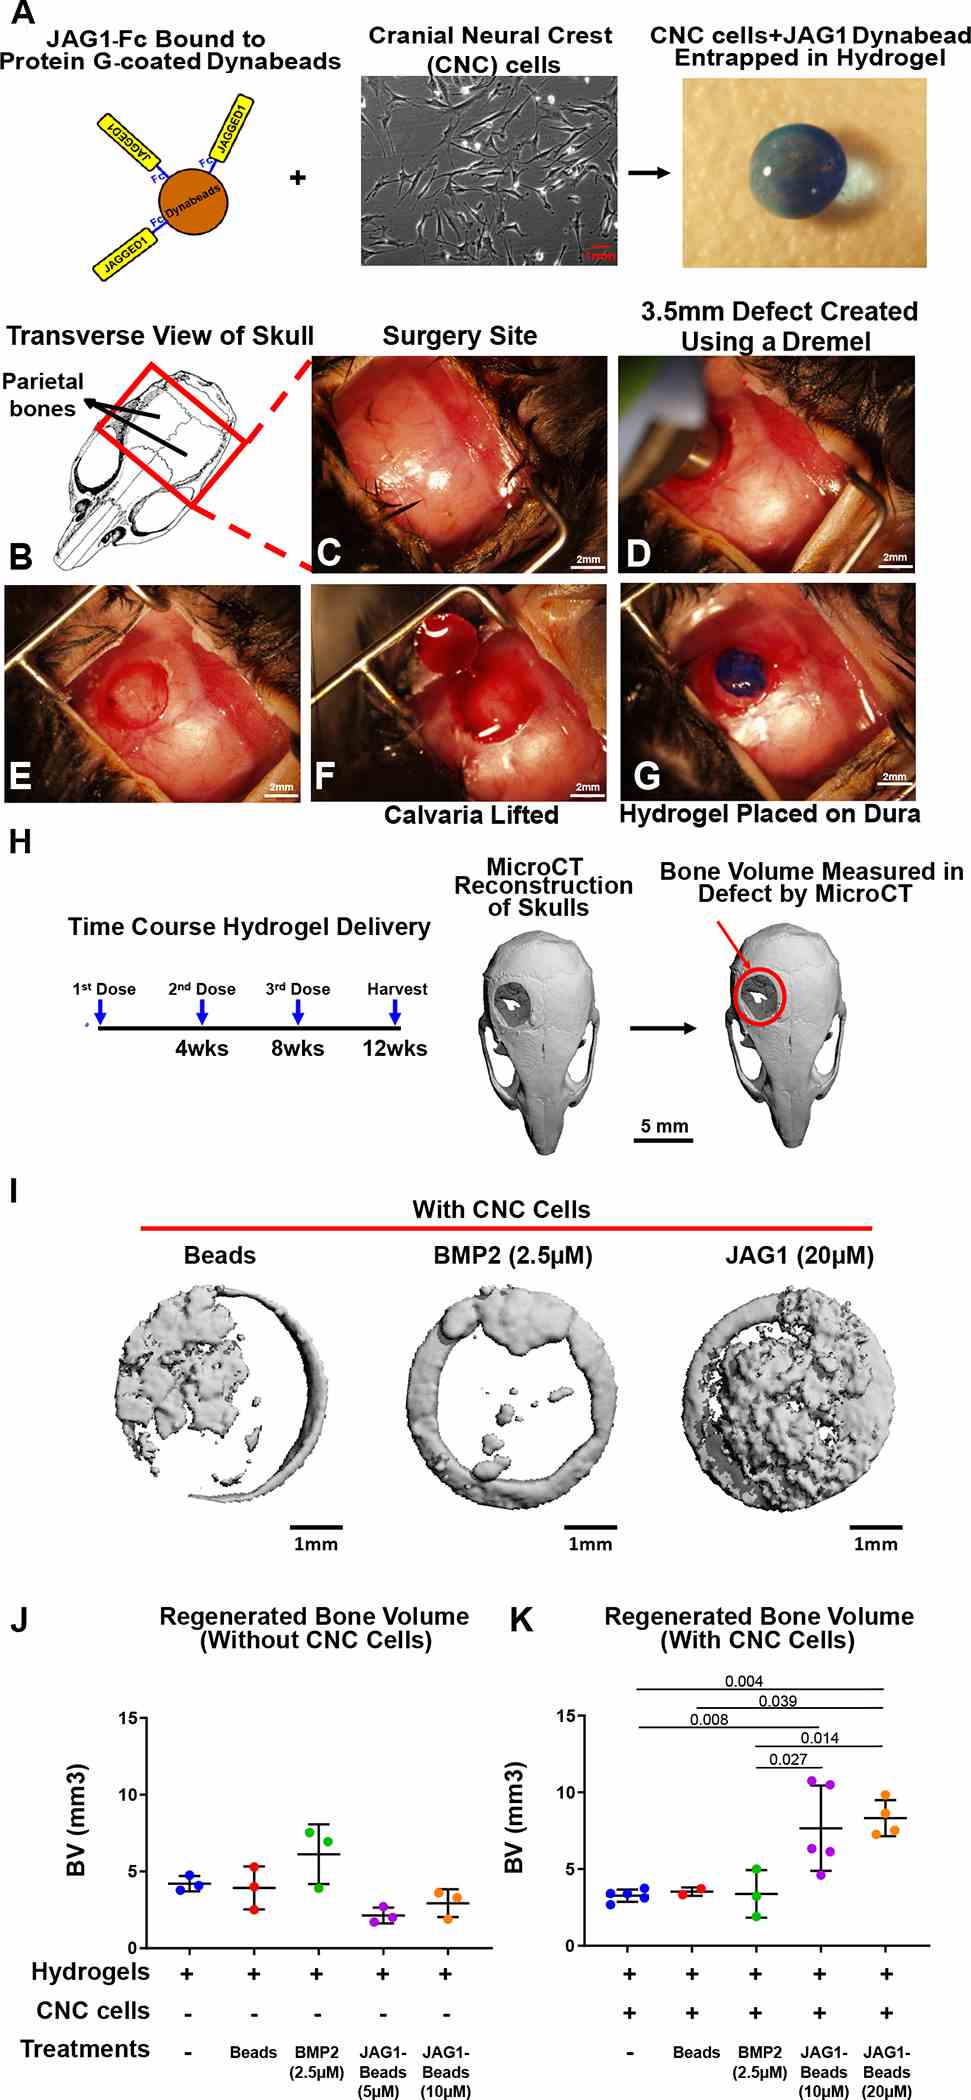
As a proof of concept experiment, we (A) incorporated
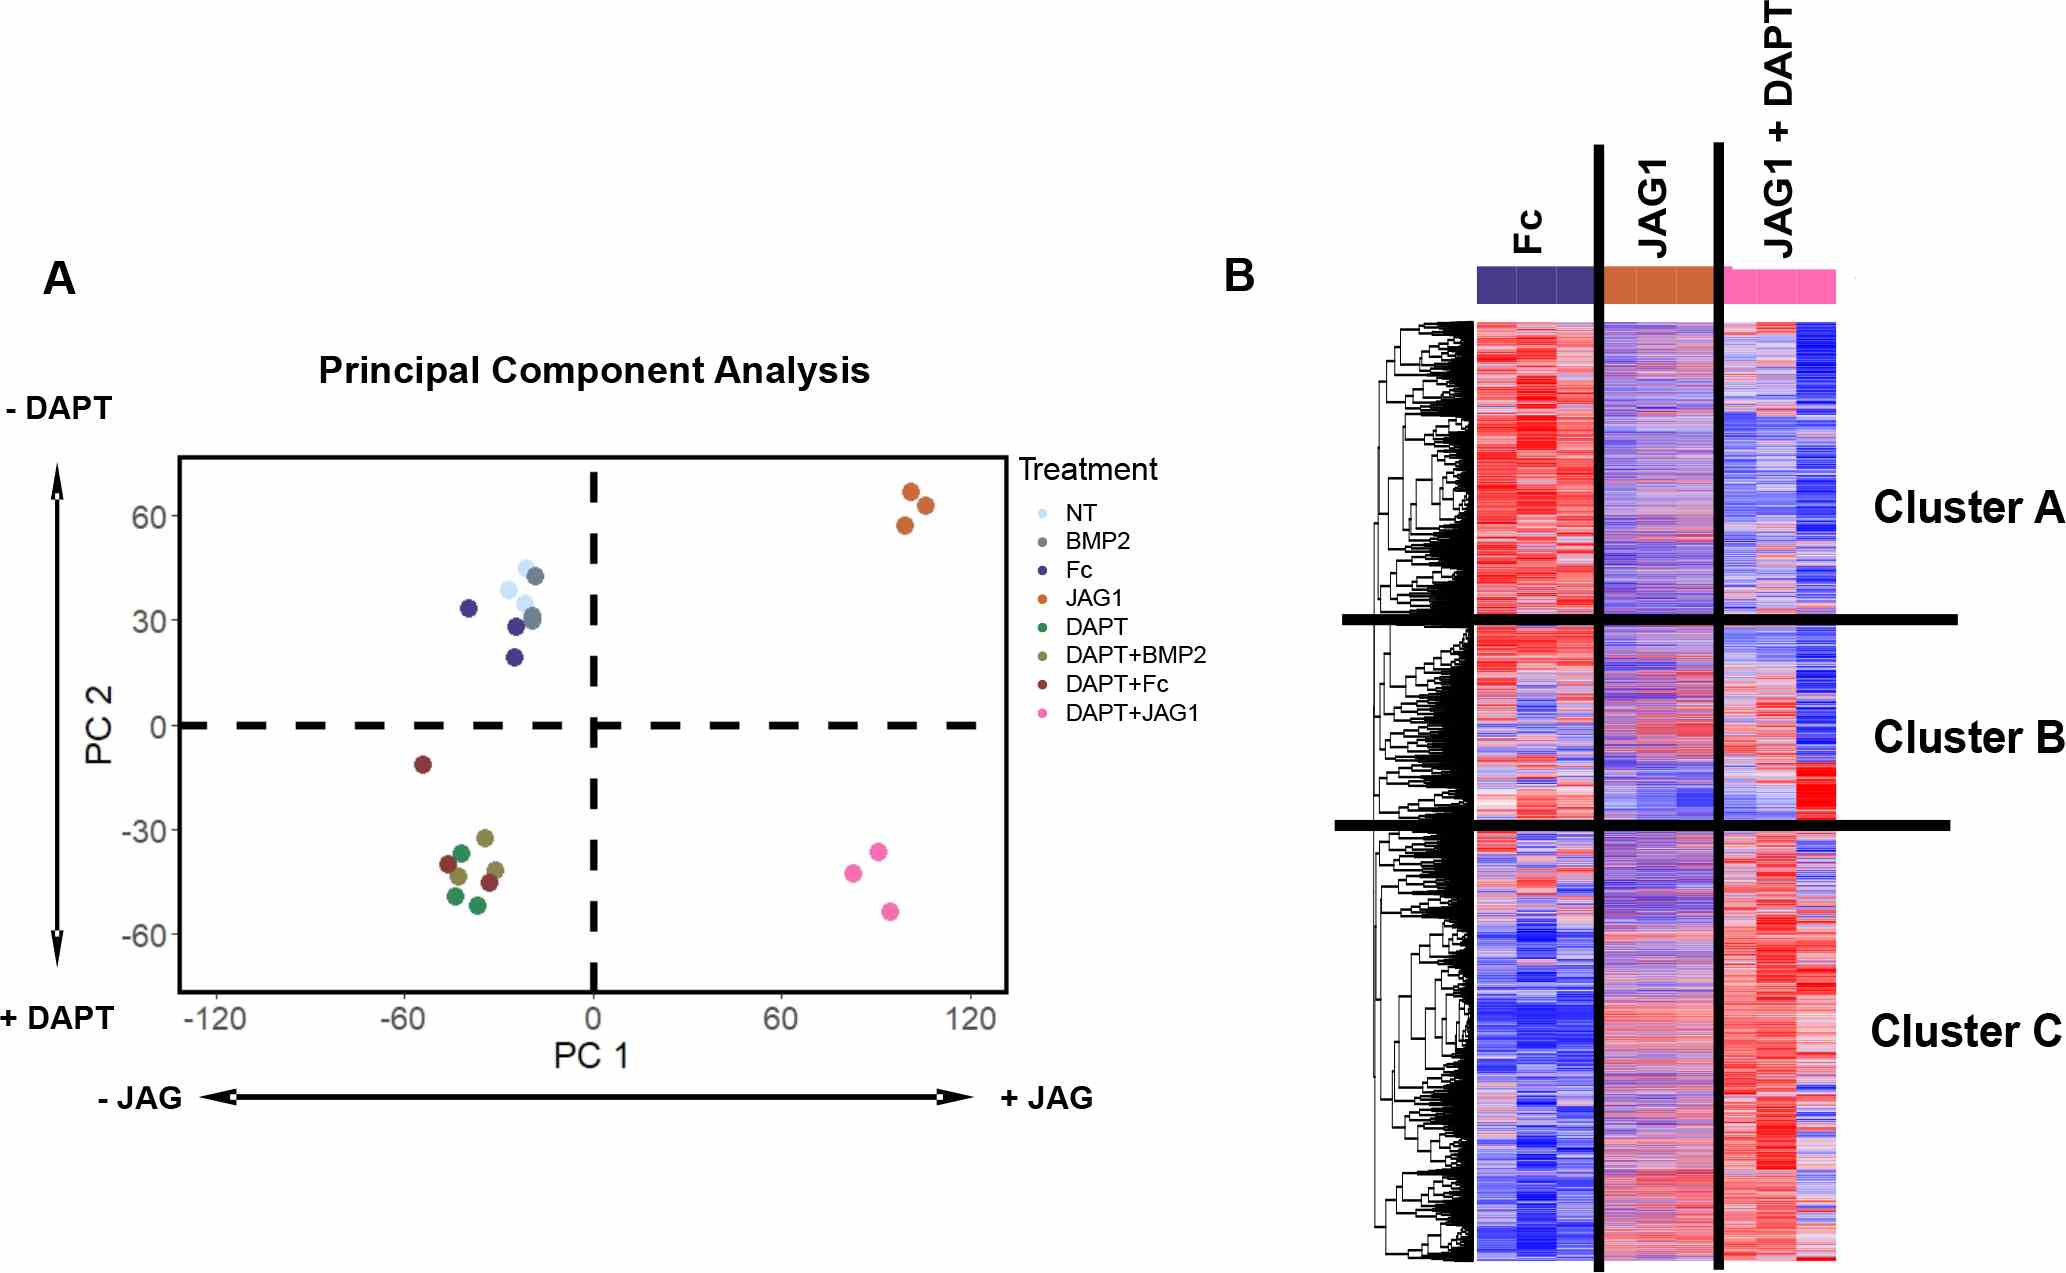
(A) A principal component analysis of all treatments revealed that PC1 distinguished
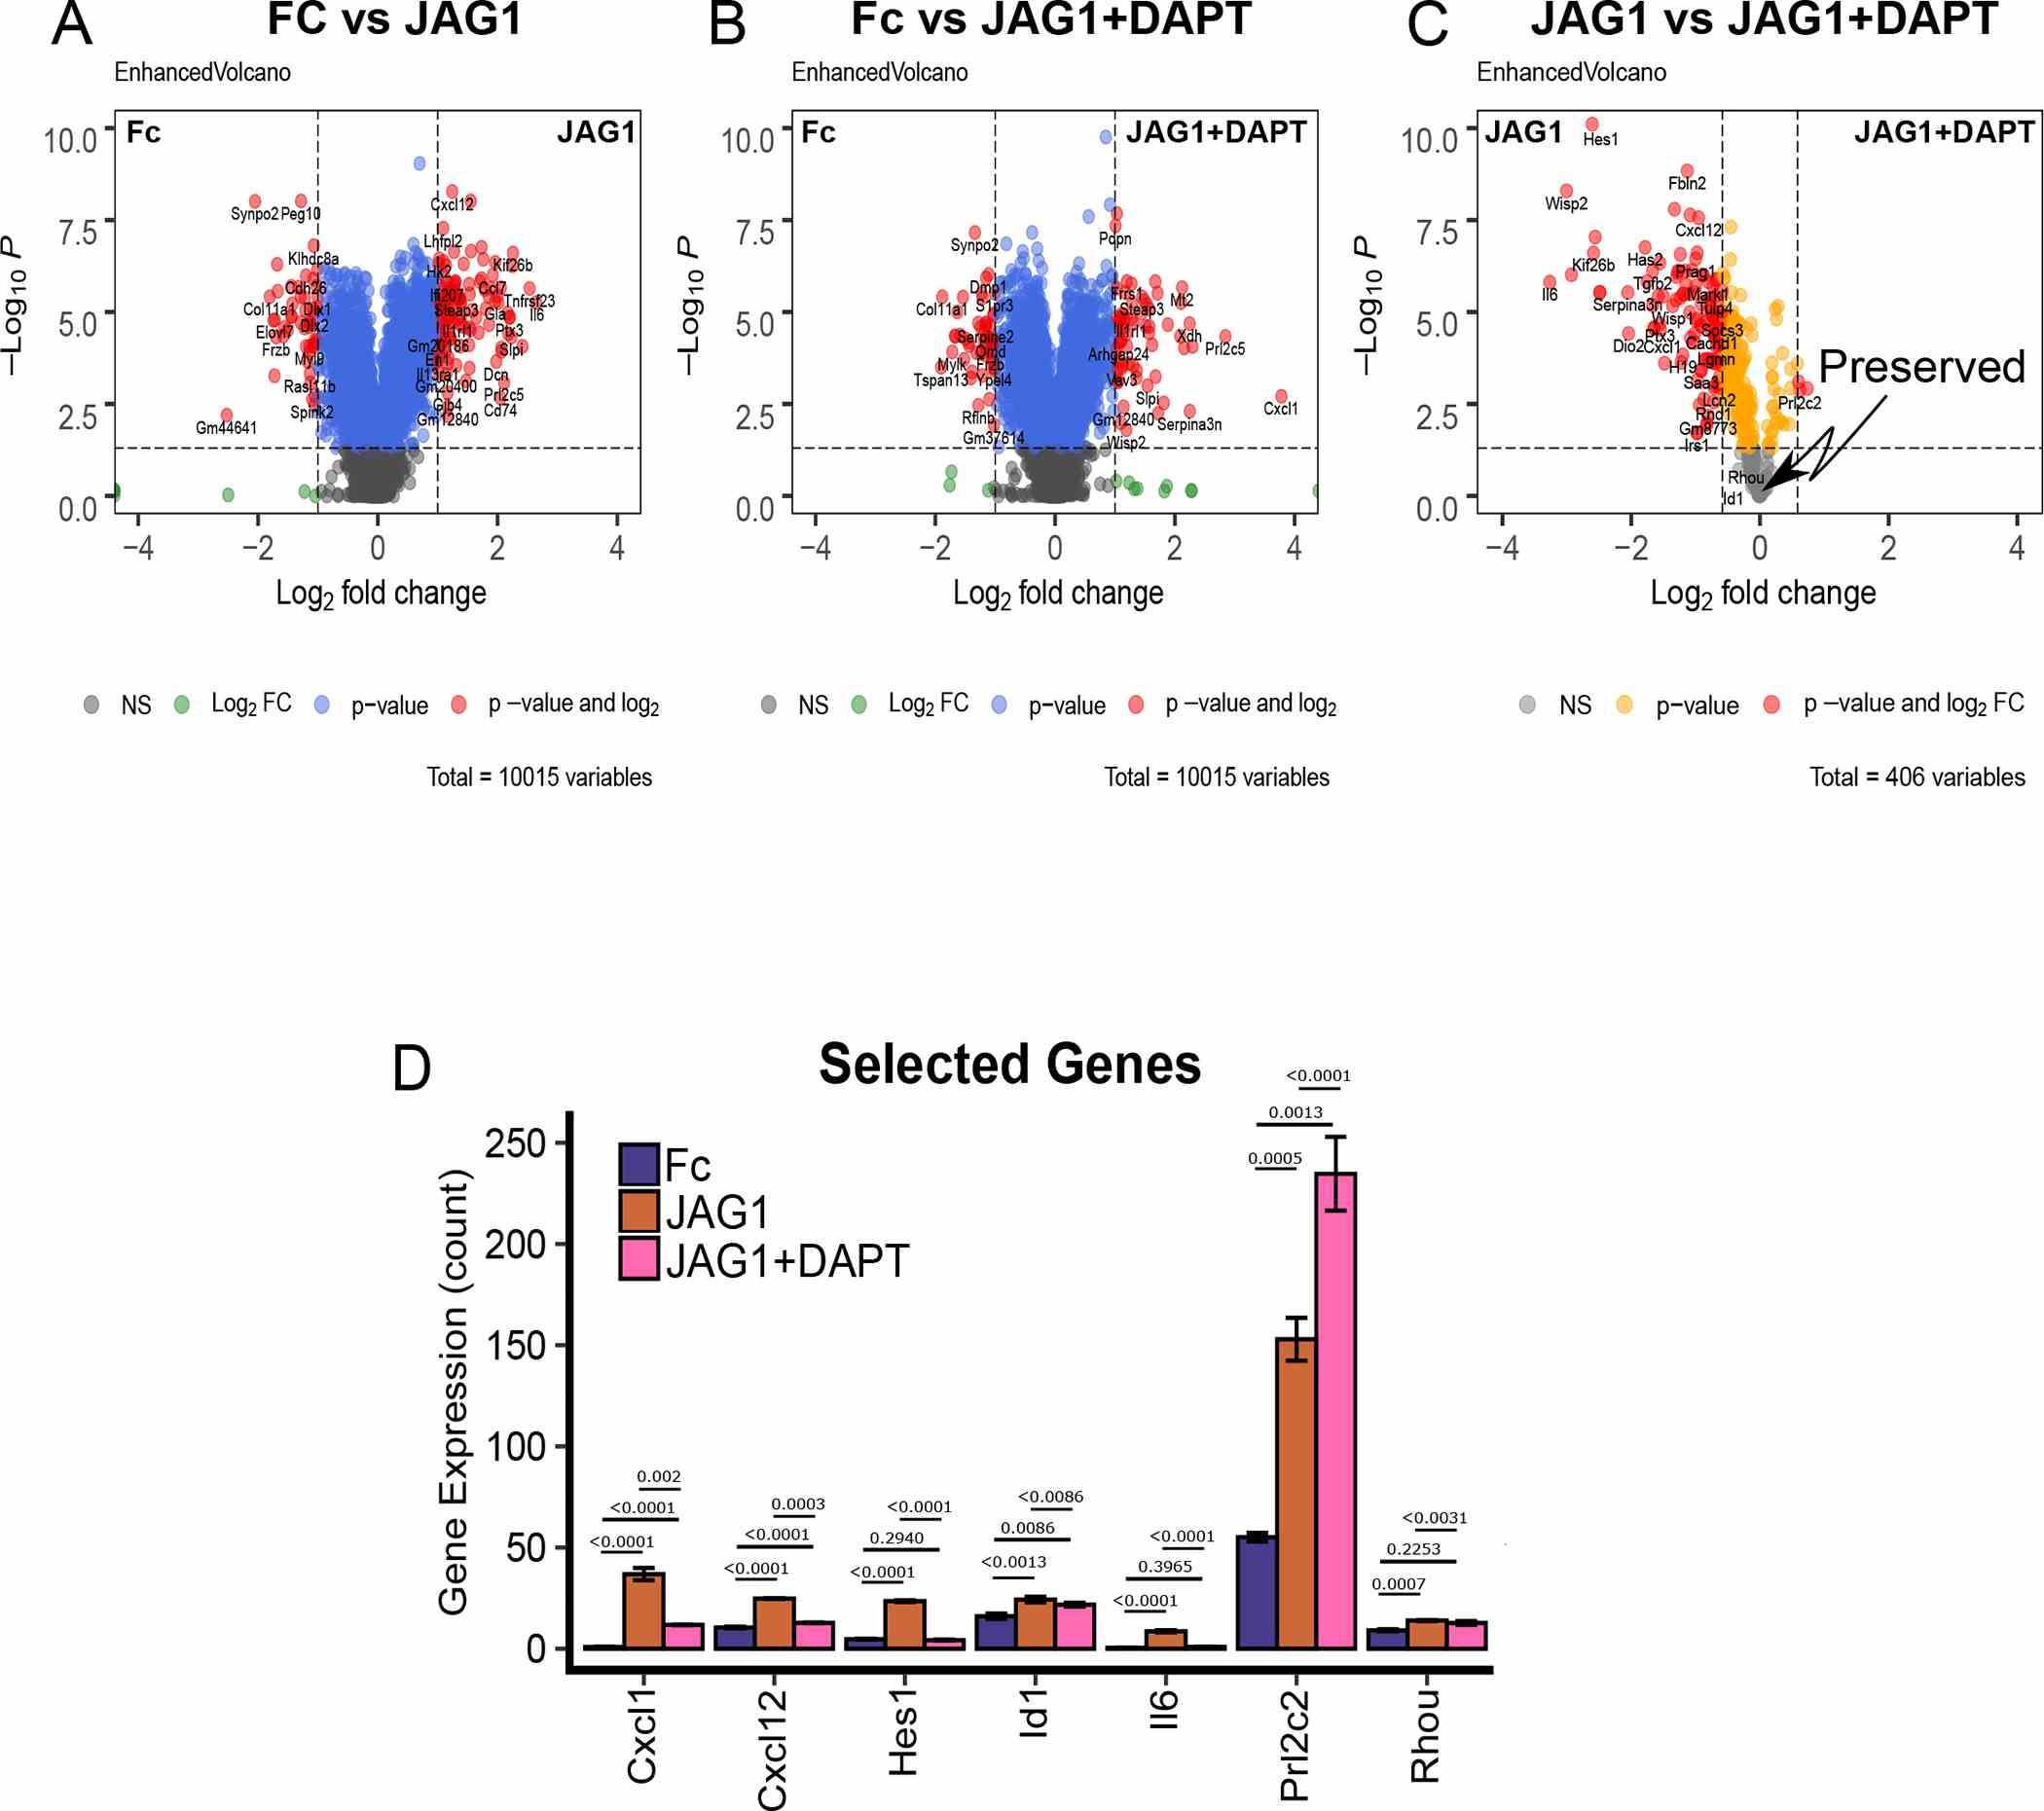
(A-B) Volcano plots of differentially expressed genes in CNC cells that were treated with
Controlled JAGGED1 delivery induces human embryonic palate mesenchymal cells to form osteoblasts
Journal: Journal of biomedical materials research. Part A PubMed ID: 28913955 Data: 2019/2/1
Authors: Jean De La Croix Ndong, Yvonne Stephenson, Steven Goudy
Article Snippet:Culture well chambered coverglass were pre-coated with rabbit anti-human IgG (10 μg/mL) in phosphate saline buffer (PBS) for 30 min at 37°C and subsequently blocked with cell culture growth medium for 30 min. Chambered coverglass were then coated with 5 μg/mL JAGGED1/Fc (JAG1–3138 H, Creative BioMart) diluted in growth media for 2 hours at 37°C.. As control for JAGGED1, human IgG (5 μg/mL) was used.As control for JAGGED1, human IgG (5 μg/mL) was used.
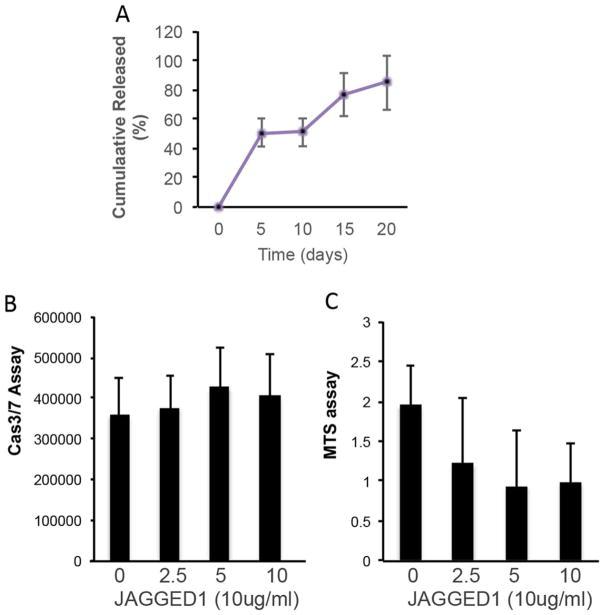
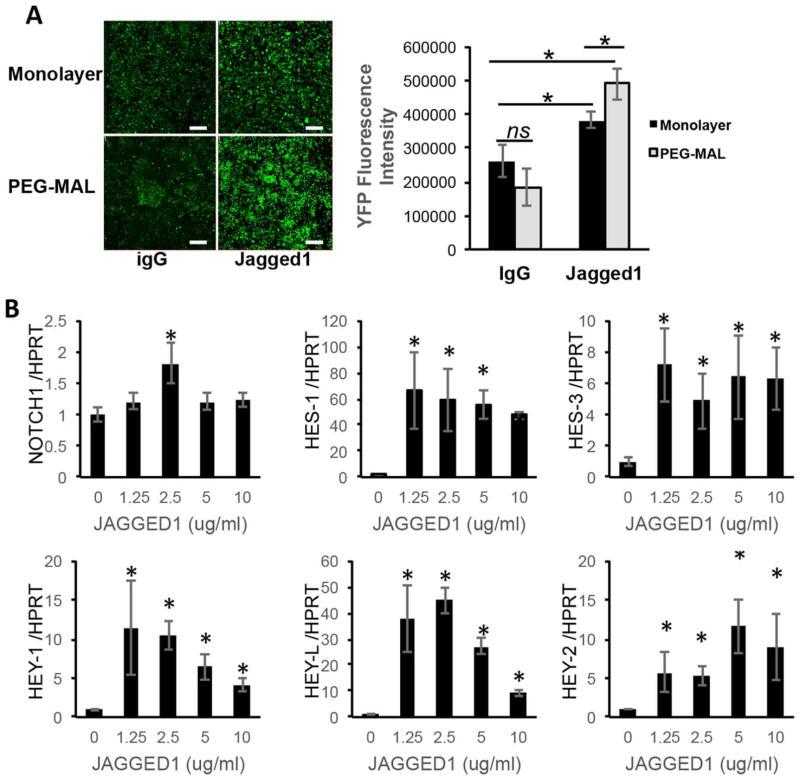
Activation of Notch Signaling Pathway by Jagged-1PEG-MAL. HEPM cells or Notch reporter CHO cells were encapsulated in functionalized
Not For Human Consumption!
Inquiry
- Reviews (1)
- Q&As (0)
Customer Reviews
Write a reviewThanks for reaching out, I hope you’ve been well. Yes, your product worked as great as it always has for us, thank you for asking

Ask a Question for All JAG1 Products
Required fields are marked with *
My Review for All JAG1 Products
Required fields are marked with *