


Recombinant Human HDAC5 protein, GST-tagged
| Cat.No. : | HDAC5-28267TH |
| Product Overview : | Recombinant Human full length HDAC5, fused with GST tag at N-terminal, was expressed in Insect cells. |
- Specification
- Gene Information
- Related Products
- Citation
- Download
| Species : | Human |
| Source : | Insect Cells |
| Tag : | GST |
| Form : | 40 mM Tris-HCl, pH 8.0, 110 mM NaCl, 2.2 mM KCl, 16 mM glutathione, 20% glycerol |
| Bio-activity : | ≥2500 pmol/min/µg. |
| Molecular Mass : | 150 kDa |
| Purity : | >8% |
| Unit Definition : | One U =1 pmol of acetyl group removed/min/µg of enzyme |
| Applications : | Useful for the study of enzyme kinetics, screening inhibitors, and selectivity profiling. |
| Storage : | >6 months at -80 centigrade. Avoid freeze/thaw cycles. |
| Concentration : | 0.04 mg/m |
| Gene Name | HDAC5 histone deacetylase 5 [ Homo sapiens ] |
| Official Symbol | HDAC5 |
| Synonyms | HDAC5; histone deacetylase 5; FLJ90614; KIAA0600; NY CO 9; antigen NY-CO-9; HD5; NY-CO-9; |
| Gene ID | 10014 |
| mRNA Refseq | NM_005474 |
| Protein Refseq | NP_005465 |
| MIM | 605315 |
| UniProt ID | Q9UQL6 |
| Chromosome Location | 17q21 |
| Pathway | B Cell Receptor Signaling Pathway, organism-specific biosystem; Cell cycle, organism-specific biosystem; MicroRNAs in cardiomyocyte hypertrophy, organism-specific biosystem; NOTCH1 Intracellular Domain Regulates Transcription, organism-specific biosystem; Signal Transduction, organism-specific biosystem; Signaling by NOTCH, organism-specific biosystem; Signaling by NOTCH1, organism-specific biosystem; |
| Function | NAD-dependent histone deacetylase activity (H3-K14 specific); NAD-dependent histone deacetylase activity (H3-K9 specific); NAD-dependent histone deacetylase activity (H4-K16 specific); histone deacetylase activity; histone deacetylase activity (H3-K16 specific); hydrolase activity; protein binding; protein kinase C binding; repressing transcription factor binding; transcription factor binding; contributes_to transcription regulatory region DNA binding; |
| ◆ Recombinant Proteins | ||
| HDAC5-312H | Active Recombinant Human HDAC5 Protein | +Inquiry |
| Hdac5-1593M | Recombinant Mouse Histone Deacetylase 5, GST-tagged | +Inquiry |
| HDAC5-4647H | Recombinant Human HDAC5 Protein, GST-tagged | +Inquiry |
| HDAC5-164H | Recombinant Human HDAC5 Protein, His-tagged | +Inquiry |
| HDAC5-1876R | Recombinant Rhesus Macaque HDAC5 Protein, His (Fc)-Avi-tagged | +Inquiry |
| ◆ Cell & Tissue Lysates | ||
| HDAC5-5604HCL | Recombinant Human HDAC5 293 Cell Lysate | +Inquiry |
Functional Interaction of Histone Deacetylase 5 (HDAC5) and Lysine-specific Demethylase 1 (LSD1) Promotes Breast Cancer Progression
Journal: Oncogene PubMed ID: 27212032 Data: 2016/4/17
Authors: Chunyu Cao, Shauna N. Vasilatos, Yi Huang
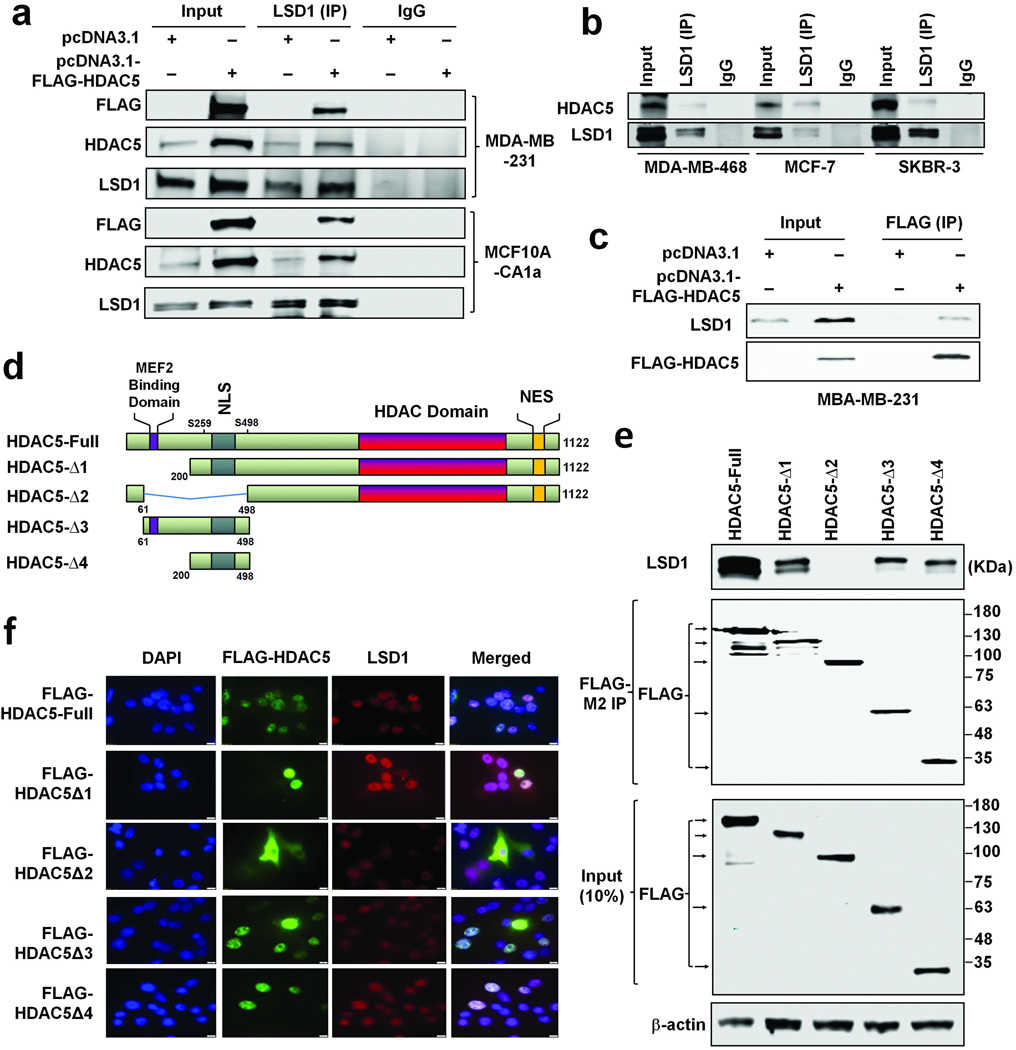
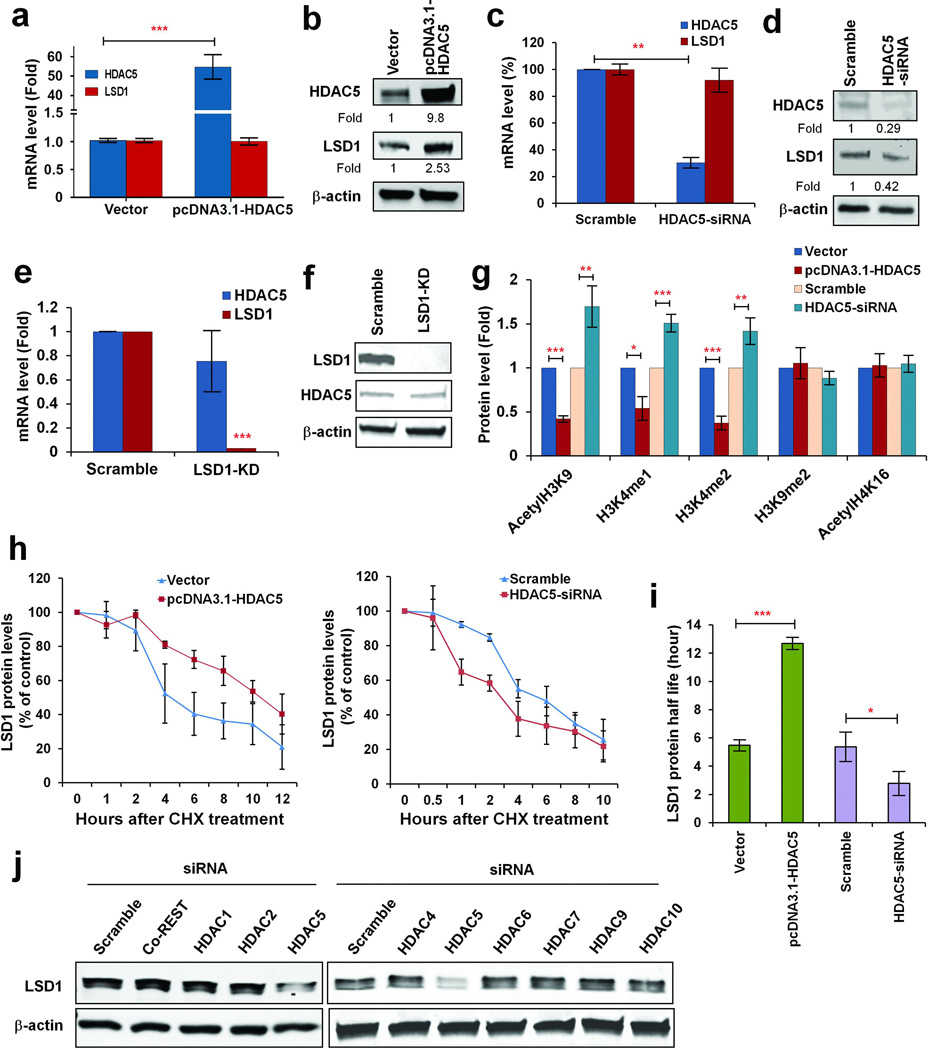
Article Snippet:Pull-down of IgG was used as negative control.Pull-down of IgG was used as negative control.. 0.25 μg of recombinant human GST-tagged HDAC5 protein (Creative BioMart, NY, NY) was mixed with 30 μl immunoprecipitates or 1.5 μg bulk histone at 37°C for 6h in a buffer containing 40 mM Tris-HCl (pH 8.0), 2.5 mM MgCl2, 50 mM NaCl, 2 mM KCl, 0.5mM DTT, 1mM EDTA and protease inhibitor.. The reactions were then subjected to immunoblots with anti-acetyl lysine antibody (EMD Millipore, Billerica, MA).The reactions were then subjected to immunoblots with anti-acetyl lysine antibody (EMD Millipore, Billerica, MA).
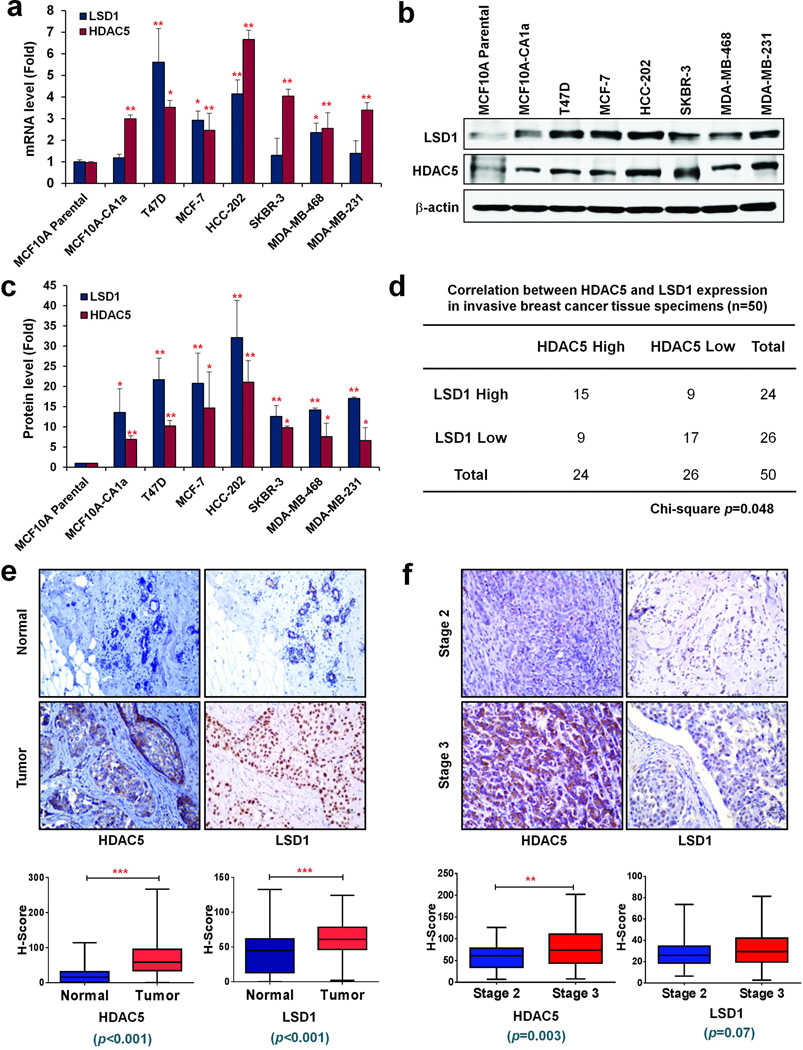
Correlated overexpression of
Not For Human Consumption!
Inquiry
- Reviews (0)
- Q&As (0)


Ask a Question for All HDAC5 Products
Required fields are marked with *
My Review for All HDAC5 Products
Required fields are marked with *