


Recombinant Human NF1, GST-tagged
| Cat.No. : | NF1-335H |
| Product Overview : | Recombinant Human NF1(2719 a.a. - 2818 a.a.), fused with GST-tag at N-terminal, was expressed in wheat germ. |
- Specification
- Gene Information
- Related Products
- Citation
- Download
| Species : | Human |
| Source : | Wheat Germ |
| Tag : | GST |
| Description : | This gene product appears to function as a negative regulator of the ras signal transduction pathway. Mutations in this gene have been linked to neurofibromatosis type 1, juvenile myelomonocytic leukemia and Watson syndrome. The mRNA for this gene is subject to RNA editing (CGA>UGA->Arg1306Term) resulting in premature translation termination. Alternatively spliced transcript variants encoding different isoforms have also been described for this gene. |
| Molecular Mass : | 36.74 kDa |
| AA Sequence : | DTYLPGIDEETSEESLLTPTSPYPPALQSQLSITANLNLSNSMTSLATSQHSPGIDKENVELSPTTGHCNSGRTR HGSASQVQKQRSAGSFKRNSIKKIV |
| Applications : | ELISA; WB-Re; AP; Array |
| Storage : | Store at -80°C. Aliquot to avoid repeated freezing and thawing. |
| Storage Buffer : | 50 mM Tris-HCI, 10 mM reduced Glutathione, pH=8.0 in the elution buffer. |
| Gene Name | NF1 neurofibromin 1 [ Homo sapiens (human) ] |
| Official Symbol | NF1 |
| Synonyms | NF1; WSS; NFNS; VRNF; neurofibromin 1; neurofibromin; neurofibromatosis-related protein NF-1 |
| Gene ID | 4763 |
| mRNA Refseq | NM_000267 |
| Protein Refseq | NP_000258 |
| MIM | 613113 |
| UniProt ID | P21359 |
| Chromosome Location | 17q11.2 |
| Pathway | ATF-2 transcription factor network; FOXA2 and FOXA3 transcription factor networks; Integrated Breast Cancer Pathway |
| Function | Ras GTPase activator activity; phosphatidylcholine binding; phosphatidylethanolamine binding |
| ◆ Recombinant Proteins | ||
| NF1-335H | Recombinant Human NF1, GST-tagged | +Inquiry |
| NF1-2983H | Recombinant Human NF1 protein(1566-1837aa), His&Myc-tagged | +Inquiry |
| NF1-32H | Active Recombinant Human NF1 Protein (1197-1528), N-His tagged | +Inquiry |
| NF1-334H | Recombinant Human NF1 Protein, His-tagged | +Inquiry |
| NF1-01HFL | Recombinant Full Length Human NF1 Protein, His tagged | +Inquiry |
An essential role for Argonaute 2 in EGFR-KRAS signaling in pancreatic cancer development
Journal: Nature Communications PubMed ID: 32499547 Data: 2020/6/4
Authors: Sunita Shankar, Jean Ching-Yi Tien, Arul M. Chinnaiyan
Article Snippet:Purified catalytic domains of SOS1 (Cytoskeleton) and NF1 (Creative BioMart) were used to carry out nucleotide exchange and GTPase activity.. Full-length KRAS and KRAS G12V were purified using bacterial expression at the University of Michigan Proteomic Core.Full-length KRAS and KRAS G12V were purified using bacterial expression at the University of Michigan Proteomic Core.
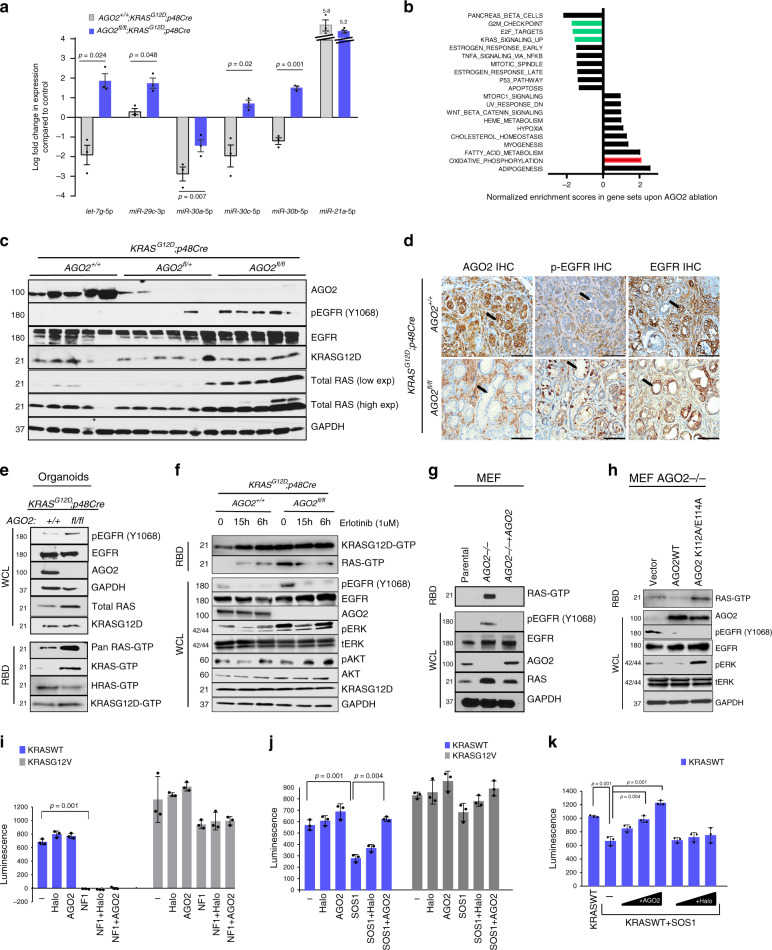
a Plot showing relative expression of microRNAs from pancreata obtained from three mice from each of the indicated genotypes at the 500-day time point. Log fold change values were generated relative to microRNA expression in three p48Cre mice (used as reference). Two sided t -tests were performed to determine the P value and error bars are mean values +/? SEM. b GSEA (Gene Set Enrichment Analysis) of transcriptional changes significantly enriched (FDR value < 0.05) in pancreatic tissue. Green and red bars represent relevant gene sets discussed in the main text. c Immunoblot analysis from individual pancreata obtained from 12-week-old mice of the indicated genotypes. d Representative images of IHC analysis in PanINs of 12-week-old mice in the indicated genotypes. Arrows indicate PanINs. Scale bar, 100 μm. e Immunoblot analysis of pancreatic ductal organoids obtained from 12-week-old AGO2 +/+ ; KRAS G12D ;p48Cre and AGO2 fl/fl ;KRAS G12D ;p48Cre mice. Total RAS-GTP was determined using the RAF binding assay (RBD) followed by immunoblotting with indicated antibodies. f Immunoblot analysis of pancreatic organoids upon treatment with erlotinib at 6 h and 15 h time points. g Immunoblot analysis of parental, AGO2?/? , and AGO2?/? + AGO2 mouse embryonic fibroblasts (MEF). RAS-GTP levels were determined by the RAF binding assay. h Immunoblot analysis of AGO2?/? MEFs stably expressing vector, wild-type AGO2, and AGO2 K112A/E114A . i Full-length wild-type KRAS and KRAS G12V proteins were incubated with
Not For Human Consumption!
Inquiry
- Reviews (0)
- Q&As (0)


Ask a Question for All NF1 Products
Required fields are marked with *
My Review for All NF1 Products
Required fields are marked with *