


Recombinant Rat POLA1 Protein
| Cat.No. : | POLA1-4560R |
| Product Overview : | Recombinant Rat POLA1 full length or partial length protein was expressed. |
- Specification
- Gene Information
- Related Products
- Citation
- Download
| Species : | Rat |
| Source : | Mammalian Cells |
| Tag : | His |
| Form : | Liquid or lyophilized powder |
| Endotoxin : | < 1.0 EU per μg of the protein as determined by the LAL method. |
| Purity : | >80% |
| Notes : | This item requires custom production and lead time is between 5-9 weeks. We can custom produce according to your specifications. |
| Storage : | Store it at +4 ºC for short term. For long term storage, store it at -20 ºC~-80 ºC. |
| Storage Buffer : | PBS buffer |
| Gene Name | Pola1 polymerase (DNA directed), alpha 1, catalytic subunit [ Rattus norvegicus ] |
| Official Symbol | POLA1 |
| Gene ID | 85241 |
| mRNA Refseq | NM_053479.1 |
| Protein Refseq | NP_445931.1 |
| MIM | |
| UniProt ID | O89042 |
| ◆ Recombinant Proteins | ||
| POLA1-8020H | Recombinant Human POLA1 protein, His & T7-tagged | +Inquiry |
| POLA1-4560R | Recombinant Rat POLA1 Protein | +Inquiry |
| POLA1-28359TH | Recombinant Human POLA1 | +Inquiry |
| Pola1-8021M | Recombinant Mouse Pola1 protein, His & T7-tagged | +Inquiry |
| POLA-938H | Recombinant Human POLA1 protein | +Inquiry |
Mechanism of action of the atypical retinoid ST1926 in colorectal cancer: DNA damage and DNA polymerase α
Journal: American Journal of Cancer Research PubMed ID: 29416919 Data: 2018/1/1
Authors: Rana Abdel-Samad, Patrick Aouad, Nadine Darwiche
Article Snippet:The final concentrations used were 0, 0.069, 0.21, 0.62, 1.9, 5.6, 17, 50, and 100 μM.The final concentrations used were 0, 0.069, 0.21, 0.62, 1.9, 5.6, 17, 50, and 100 μM.. One microliter of diluted compounds was added to 1 unit of the full length POLA1 recombinant protein (Creative BioMart, Shirley, NY), 2 μl of 10 mg/ml BSA, and 0.4 μl of 2.5 mM dNTP and pre-incubated at 25°C for 15 minutes.. Afterwards, 3 μl of the primer extension substrate was added to the mixture.Afterwards, 3 μl of the primer extension substrate was added to the mixture.
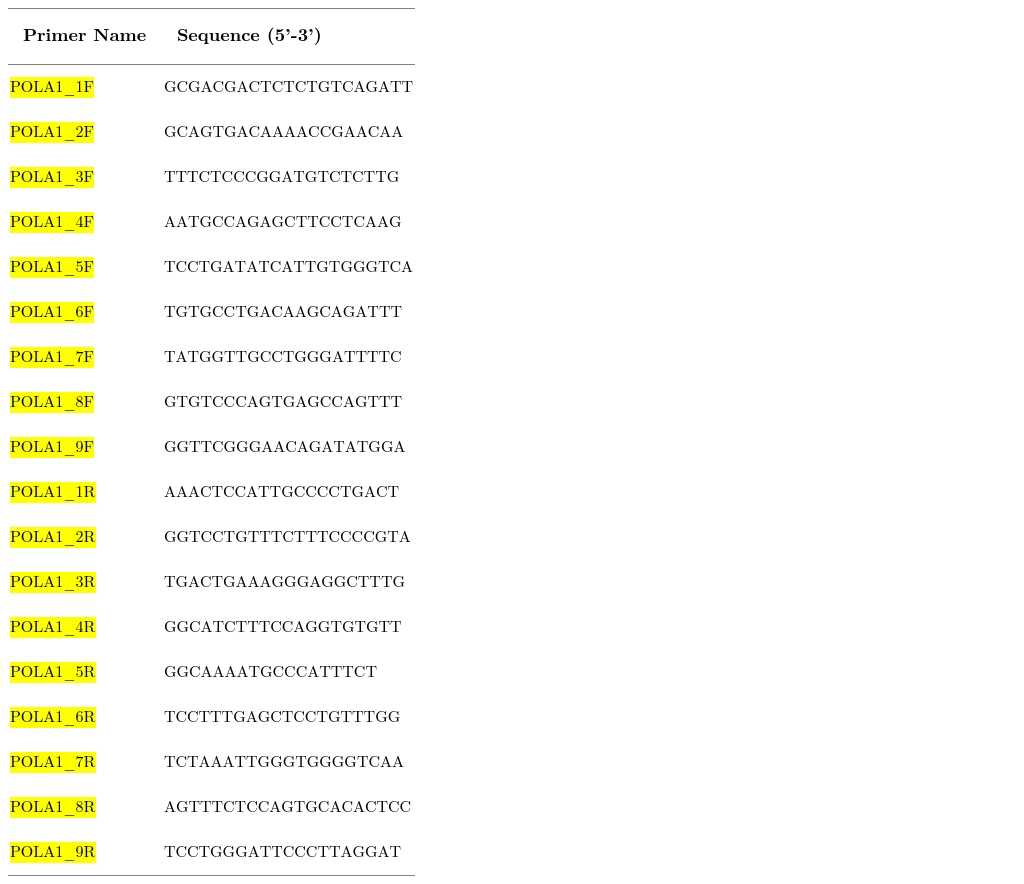
Forward and reverse primer sequences
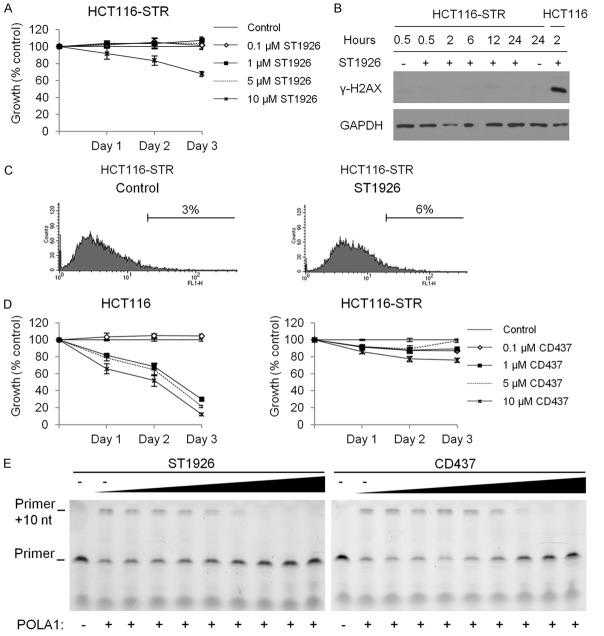
ST1926-resistant cells are cross-resistant to CD437 and both compounds inhibit
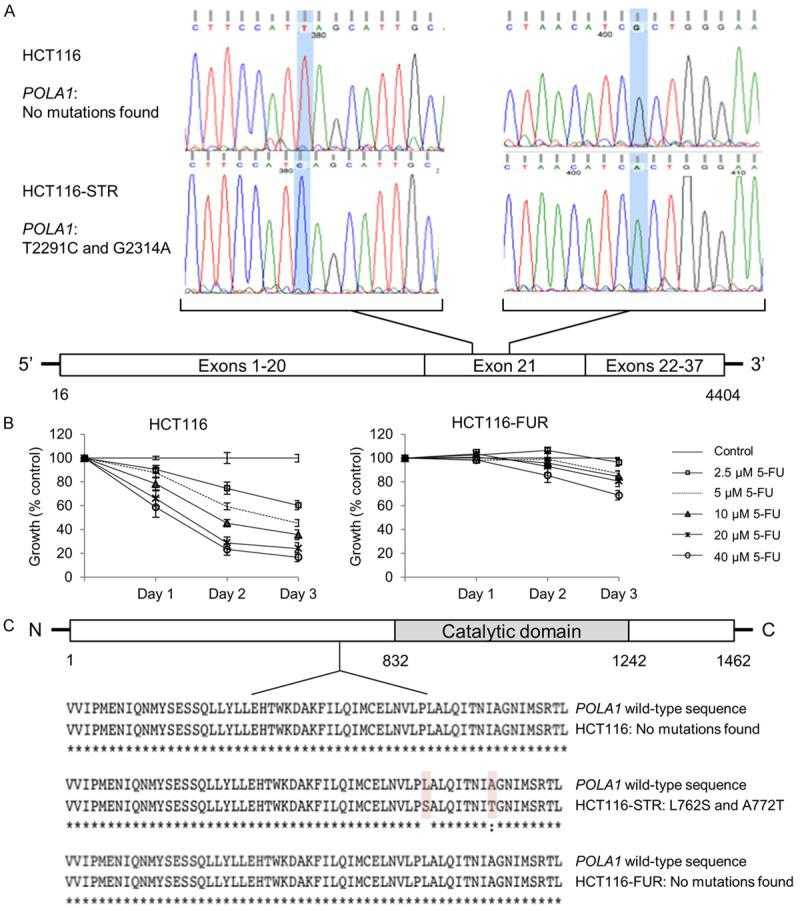
HCT116-resistant ST1926 cells exclusively harbor two missense mutations in
Not For Human Consumption!
Inquiry
- Reviews (0)
- Q&As (0)


Ask a Question for All POLA1 Products
Required fields are marked with *
My Review for All POLA1 Products
Required fields are marked with *