SRPK1/2 and PP1α exert opposite functions by modulating SRSF1-guided MKNK2 alternative splicing in colon adenocarcinoma
Journal: Journal of Experimental & Clinical Cancer Research : CR PubMed ID: 33602301 Data: 2021/2/18
Authors: Hongda Liu, Zheng Gong, Yunfei Xu
Article Snippet:The purified GST-tagged SRPK1 and GST-tagged SRPK2 proteins were purchased from Novus Biologicals (CO, USA).The purified GST-tagged SRPK1 and GST-tagged SRPK2 proteins were purchased from Novus Biologicals (CO, USA).. The His-SRSF1 protein was purchased from Creative BioMart (NY, USA).. The GST-pull down assay was conducted as described before using GST agarose beads [ ].The GST-pull down assay was conducted as described before using GST agarose beads [ ].
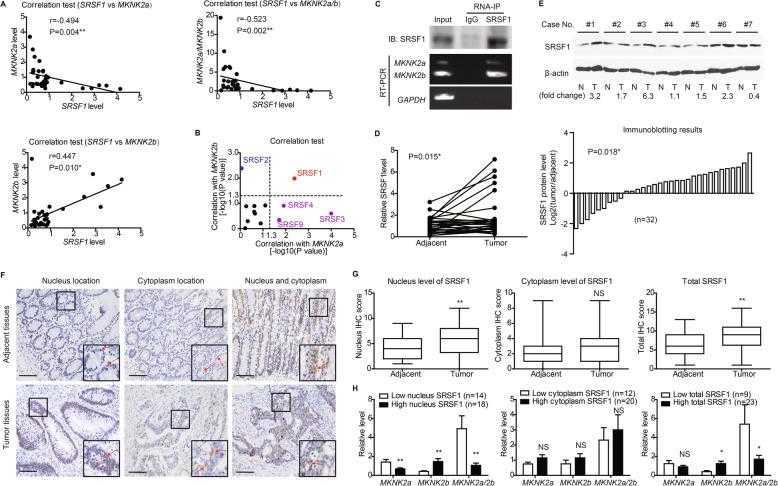
Correlation between nucleus SRSF1 location and MKNK2 alternative splicing. a SRSF1 level was tested by RT-qPCR in clinical CAC tissues ( n = 32), and its correlations with MKNK2 variants were analyzed by Spearman correlation test. b RNA levels of other well-known splicing factors were also measured by RT-qPCR. Spearman correlation tests showed that only SRSF1 was significantly correlated with both MKNK2a and MKNK2b levels, indicating its potential effect on MKNK2a - MKNK2b switch. c SW480 cells transfected with pcDNA-vector or SRSF1 constructs were subjected to RNA-IP using anti-SRSF1 antibody in formaldehyde crosslinked nuclear extracts. The existence of SRSF1 protein and MKNK2 -mRNA were tested via Western blotting and RT-PCR, respectively. d The mRNA levels of SRSF1 in 32 paired CAC tissues and adjacent nontumorous tissues were compared by RT-qPCR. P value was based on paired Student’s t-test. e Protein levels of SRSF1 in clinical specimens were also tested by western blotting (upper panel), and 71.9% cases (23/32) showed increased SRSF1 in tumor tissues (lower panel). f Immunohistochemical staining identified different subcellular location of SRSF1 in tissue specimens, including nucleus location and cytoplasm location. Scale bar: 100 μm. g Differences of SRSF1 IHC scores between CAC and adjacent nontumorous tissues were represented by box plots ( n = 32). Top and bottom box edges represented the third and first quartile. Whiskers indicated highest and lowest score. P value was based on paired Student’s t-test. h By classifying patients into different subgroups according to ROC curves (Fig. S D), we found that tissues with higher nucleus SRSF1 level or total SRSF1 level expressed more MKNK2b variant and showed a lower MKNK2a/2b ratio. In contrast, no statistical difference was observed based on cytoplasm SRSF1 level. P value was calculated by unpaired Student’s t-test
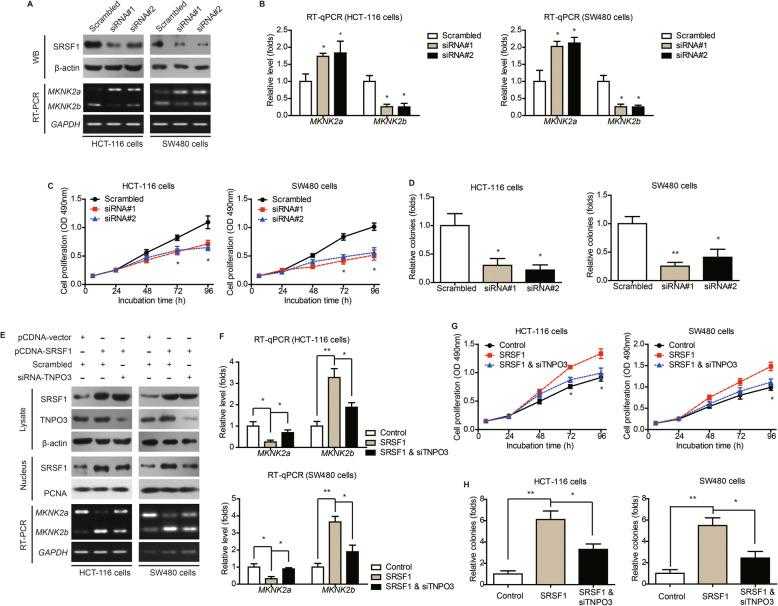
Nucleus transportation of SRSF1 exerts oncogenic effect via upregulating MKNK2b level. a HCT-116 and SW480 cells were transfected with either scrambled siRNA or siRNAs targeting SRSF1. The transfection efficiencies were verified by western blotting. The alterations of MKNK2 alternative splicing were tested by RT-PCR. b Quantitative PCR results further confirmed the role of SRSF1 on regulating MKNK2 alternative splicing. P value was based on unpaired Student’s t-test comparing with scrambled group. c MTT and colony formation ( d ) assays demonstrated that SRSF1-knockdown inhibited CAC cell proliferation. P value was based on unpaired Student’s t-test comparing with scrambled group. e Western blot results showed that silencing TNPO3 downregulated nucleus SRSF1 level, indicating nucleus importing of SRSF1 was at least partially depend on TNPO3. Moreover, RT-PCR data indicated that silencing TNPO3 attenuated the effect of SRSF1 on altering MKNK2 alternative splicing. f Quantitative PCR results further verified the role of TNPO3-siRNA on attenuating SRSF1-induced MKNK2a-MKNK2b switch. P value was based on unpaired Student’s t-test comparing with SRSF1 group. g MTT and colony formation ( h ) assays demonstrated that TNPO3-knockdown attenuated the oncogenic effect of SRSF1 on CAC cell proliferation. P value was based on unpaired Student’s t-test comparing with SRSF1 group
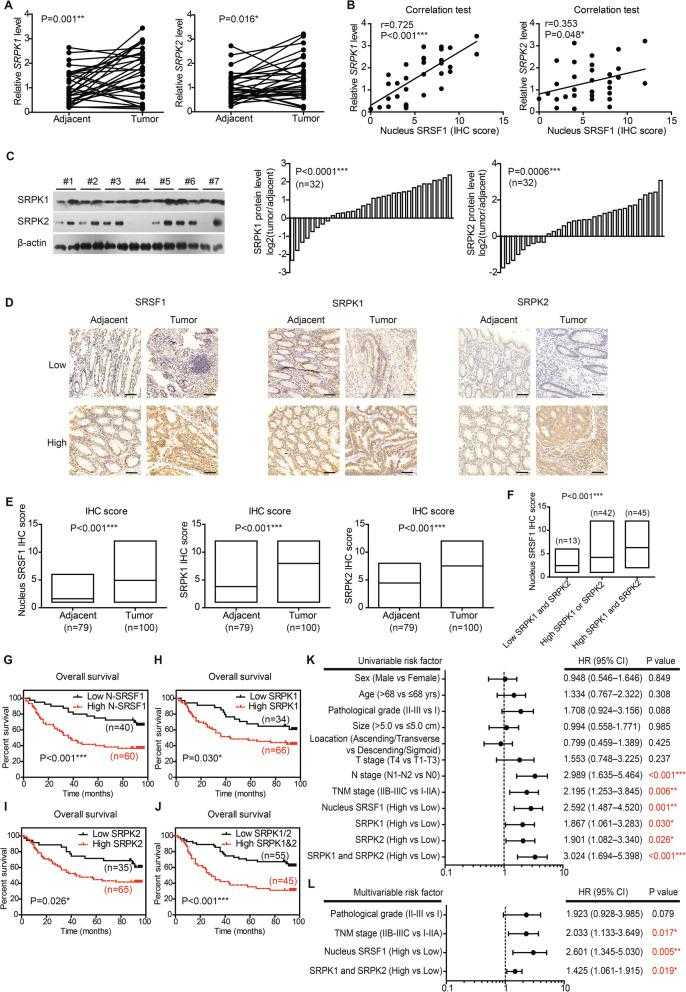
Expression and prognostic role of SRPKs in CAC. a RNA levels of upstream kinases targeting splicing factors in paired clinical specimens were tested by RT-qPCR ( n = 32). P value was based on paired Student’s t-test. b Correlations between nucleus SRSF1 level and upstream kinases were analyzed via Spearman correlation test ( n = 32). The nucleus SRSF1 level was scored by the specific nucleus staining of SRSF1 (ranging 0–12) without considering its cytosol staining. c Protein levels of SRPK1 and SRPK2 in paired clinical specimens were tested by western blotting (left panel). After semi-quantified, we found that 75% cases (24/32) showed increased SRPK1 in tumor tissues (middle panel), and 71.9% cases (23/32) exhibited increased SRPK2 (right panel). d Representative IHC results of SRSF1, SRPK1, and SRPK2 in specimens from validation cohort. Scale bar: 100 μm. e The different protein levels of SRPK1, SPRK2, and nucleus SRSF1 in validation cohort were exhibited by box plots according to IHC data. P value was based on unpaired Student’s t-test. f Patients with both high-SRPK1 and high-SRPK2 levels exhibited the highest nucleus SRSF1 level, while patients with low SRPK1 and low SRPK2 showed the lowest nucleus SRSF1 IHC score. P value was based on One-way ANOVA test. Kaplan-Meier survival curves showed the clinical relevance of nucleus SRSF1 ( g ), SRPK1 ( h ), and SRPK2 ( i ) in validation cohort of CAC patients, respectively. Furthermore, the higher expression of both SRPK1 and SRPK2 showed a more significant role on indicating poorer overall survival ( j ). Forest plots summarized the significant prognostic factors by univariate ( k ) and multivariate ( l ) analyses, the corresponding data were supplemented in Table S and Table S5. P value was calculated by log-rank test or Cox-regression test


