


Recombinant Human CDH2 protein, His-Fc-tagged 
| Cat.No. : | CDH2-315H |
| Product Overview : | Recombinant Human CDH2 protein(NP_001783.2) (Met 1-Ala 724) was expressed in HEK293, fused with the C-terminal polyhistidine-tagged Fc region of human IgG1 at the C-terminus. |
| Availability | July 16, 2026 |
| Unit | |
| Price | |
| Qty |
- Specification
- Gene Information
- Related Products
- Citation
- Download
| Species : | Human |
| Source : | HEK293 |
| Tag : | Fc&His |
| Protein Length : | 1-724 aa |
| Form : | Lyophilized from sterile PBS, pH 7.4. |
| Molecular Mass : | The secreted recombinant human CDH2 is a disulfide-linked homodimeric protein. The reduced monomer comprises 813 amino acids and has a predicted molecular mass of 89.9 kDa. As a result of glycosylation, it migrates as an apximately 114 and 119 kDa band in SDS-PAGE under reducing conditions due to glycosylation. |
| Endotoxin : | < 1.0 EU per μg of the protein as determined by the LAL method. |
| Purity : | > 70 % as determined by SDS-PAGE |
| Storage : | Store it under sterile conditions at -20°C to -80°C upon receiving. Recommend to aliquot the protein into smaller quantities for optimal storage. Avoid repeated freeze-thaw cycles. |
| Reconstitution : | It is recommended that sterile water be added to the vial to prepare a stock solution of 0.2 ug/ul. Centrifuge the vial at 4°C before opening to recover the entire contents. |
| protein Refseq-Weblink : | http://www.ncbi.nlm.nih.gov/protein/NP_001783.2 |
| Unit ID : | P19022 |
| Unit ID-Weblink : | http://www.uniprot.org/uniprot/P19022 |
| Publications : |
| Gene Name | CDH2 cadherin 2, type 1, N-cadherin (neuronal) [ Homo sapiens ] |
| Official Symbol | CDH2 |
| Synonyms | CDH2; cadherin 2, type 1, N-cadherin (neuronal); NCAD; cadherin-2; CD325; CDHN; N cadherin; N-cadherin 1; neural cadherin; neural-cadherin; cadherin 2, N-cadherin (neuronal); calcium-dependent adhesion protein, neuronal; CDw325; |
| Gene ID | 1000 |
| mRNA Refseq | NM_001792 |
| protein Refseq | NP_001783 |
| MIM | 114020 |
| ◆ Recombinant Proteins | ||
| Cdh2-592M | Active Recombinant Mouse Cdh2 Protein, Fc Chimera | +Inquiry |
| CDH2-1741R | Recombinant Rhesus Monkey CDH2 Protein, hIgG1-tagged | +Inquiry |
| CDH2-2191H | Active Recombinant Human CDH2 protein, His-tagged | +Inquiry |
| CDH2-4938H | Recombinant Human CDH2 protein, GST-tagged | +Inquiry |
| CDH2-8707Z | Recombinant Zebrafish CDH2 | +Inquiry |
| ◆ Cell & Tissue Lysates | ||
| CDH2-980HCL | Recombinant Human CDH2 cell lysate | +Inquiry |
| CDH2-971MCL | Recombinant Mouse CDH2 cell lysate | +Inquiry |
A mechanically active heterotypic E-cadherin/N-cadherin adhesion enables fibroblasts to drive cancer cell invasion
Journal: Nature cell biology PubMed ID: 28218910 Data: 2018/3/1
Authors: Anna Labernadie, Takuya Kato, Xavier Trepat
Article Snippet:Bead pulling experiments were performed using magnetic tweezers as previously described 19 , 66 .Bead pulling experiments were performed using magnetic tweezers as previously described 19 , 66 .. Briefly, 4.47 μm diameter ferromagnetic beads with carboxyl surface groups (Spherotech, Lake Forest, IL) were covalently coated with a 32μg/ml solution of ,purified E-cadherin–Fc (Creative BioMart, #CDH1-274H), P-cadherin–Fc (R&D Systems, #861-PC) or N-cadherin–Fc (Creative BioMart, #CDH2-315H) proteins.. Beads were first washed with Na phosphate buffer (0.1 M, pH 8), incubated with 32 μg/ml of the Fc-tagged proteins for 5 h at 4oC and then with crosslinking buffer for 1 h (25 mM DMP, 0.2 M triethanolamine, pH 8.2).Beads were first washed with Na phosphate buffer (0.1 M, pH 8), incubated with 32 μg/ml of the Fc-tagged proteins for 5 h at 4oC and then with crosslinking buffer for 1 h (25 mM DMP, 0.2 M triethanolamine, pH 8.2).
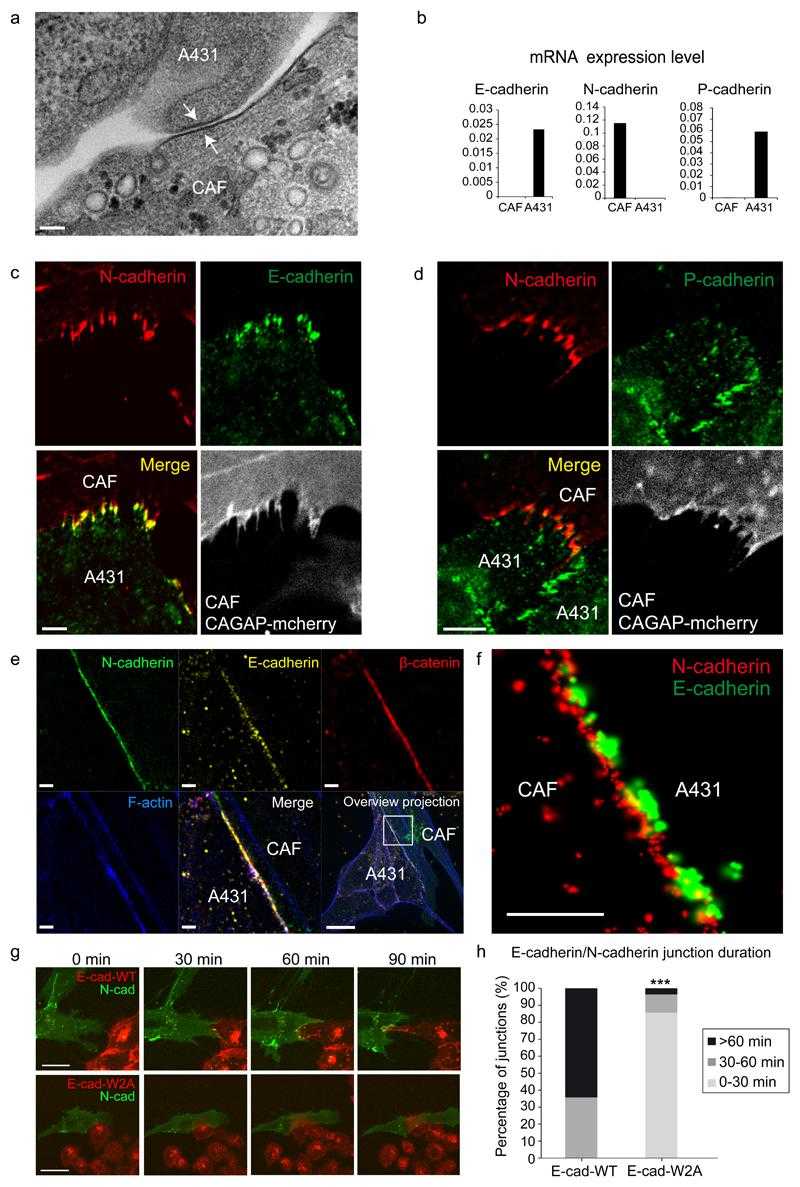
(a) TEM image of contact (white arrows) between a CAF and a A431 cell. Image representative of 20 contacts from 3 independent experiments. Scale bar 100nm. (b) mRNA expression levels of E-,N- and
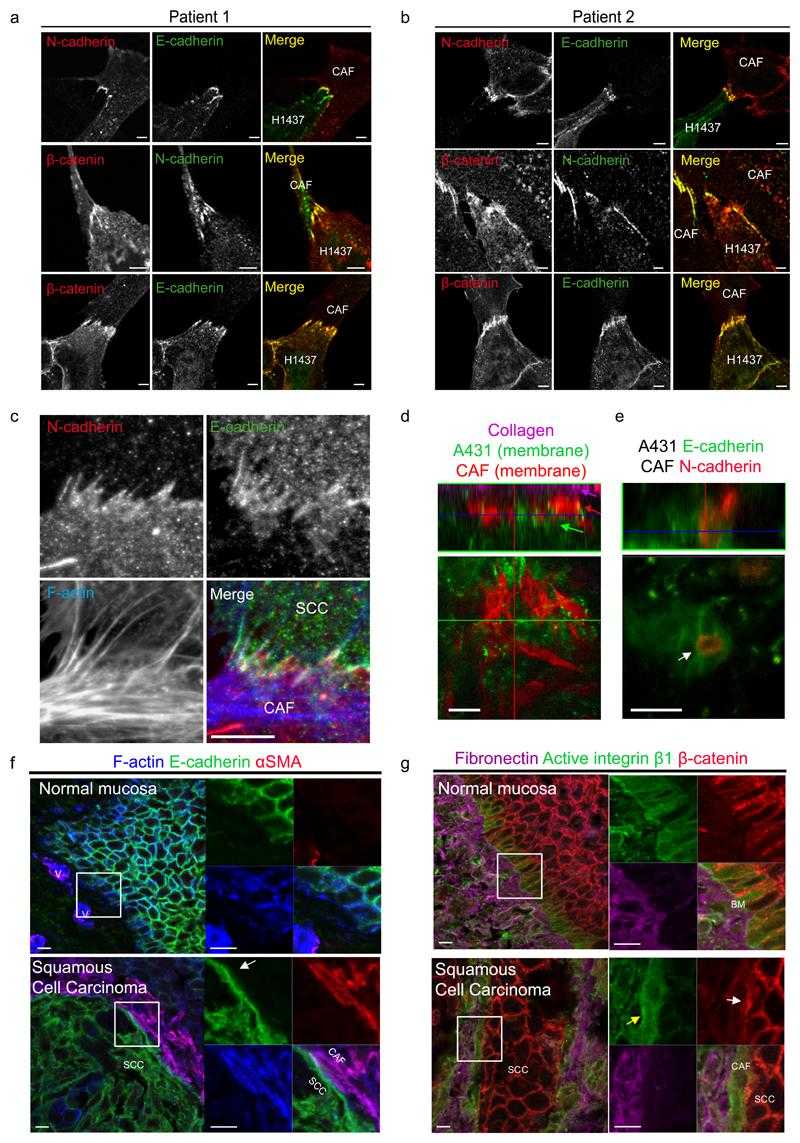
(a,b) Co-cultures of CAFs from two patients with lung adenocarcinoma and H1437 cells show
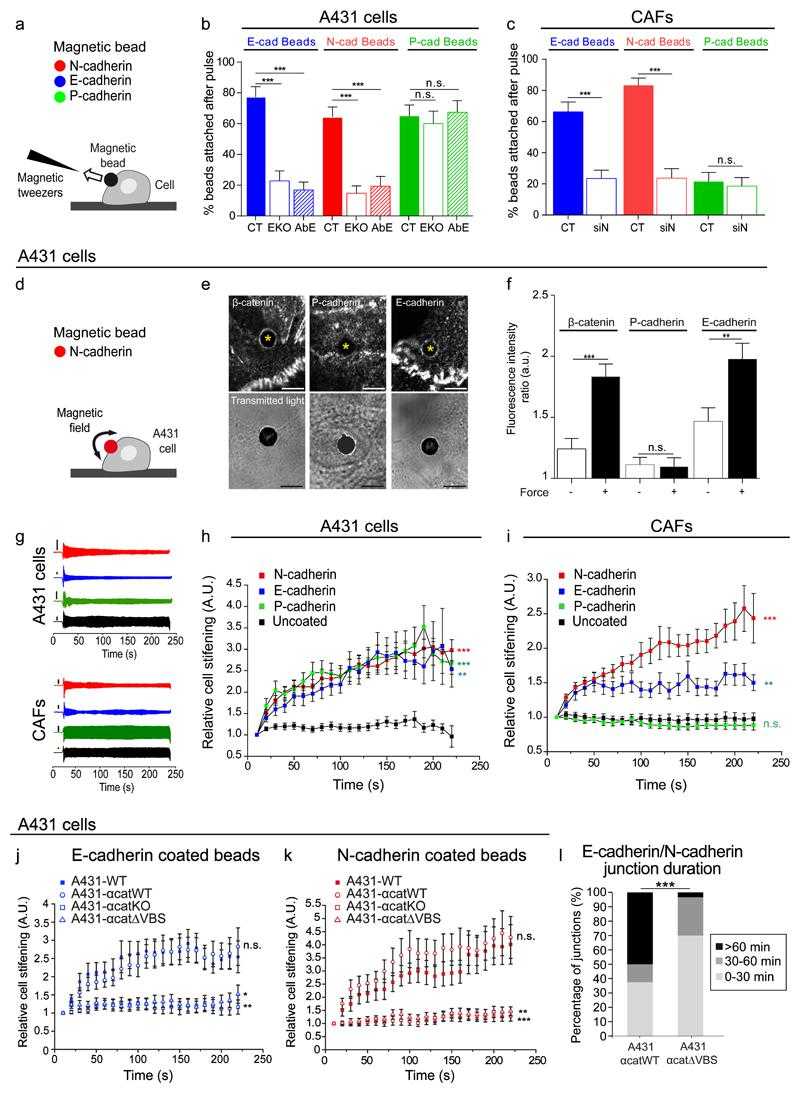
(a) Illustration of the magnetic tweezers experimental setup. (b) Bead detachment data in A431 cells (CT), A431-EcadKO cells (EKO) and A431 cells pre-treated with
Not For Human Consumption!
Inquiry
- Reviews (0)
- Q&As (0)


Ask a Question for All CDH2 Products
Required fields are marked with *
My Review for All CDH2 Products
Required fields are marked with *