


Recombinant Human IMMT protein, His-tagged 
| Cat.No. : | IMMT-838H |
| Product Overview : | Recombinant Human IMMT fused with His tag at N-terminal was expressed in E. coli. |
| Availability | July 29, 2026 |
| Unit | |
| Price | |
| Qty |
- Specification
- Gene Information
- Related Products
- Citation
- Download
| Species : | Human |
| Source : | E.coli |
| Tag : | His |
| Description : | Mitochondrial inner membrane protein is a protein that in humans is encoded by the IMMT gene. |
| Form : | 25mM Tris, pH8.0, 150 mM NaCl, 10% glycerol, 100 mM Arg. |
| Molecular Mass : | 83.7 kDa |
| Purity : | > 80% as determined by SDS-PAGE and Coomassie blue staining |
| Storage : | Store at -80 centigrade. Avoid repeated freeze-thaw cycles. Stable for at least 3 months from receipt of products under proper storage and handling conditions. |
| Concentration : | >50 ug/mL as determined by microplate BCA method |
| Publications : |
| Gene Name | IMMT inner membrane protein, mitochondrial [ Homo sapiens ] |
| Official Symbol | IMMT |
| Synonyms | IMMT; inner membrane protein, mitochondrial; inner membrane protein, mitochondrial (mitofilin); mitochondrial inner membrane protein; HMP; MINOS2; mitochondrial inner membrane organizing system 2; mitofilin; P87; P89; motor protein; proliferation-inducing gene 4; cell proliferation-inducing protein 52; cell proliferation-inducing gene 4/52 protein; PIG4; PIG52; P87/89; MGC111146; DKFZp779P1653; |
| Gene ID | 10989 |
| mRNA Refseq | NM_006839 |
| Protein Refseq | NP_006830 |
| MIM | 600378 |
| UniProt ID | Q16891 |
| Chromosome Location | 2p11.2 |
| Function | protein binding; |
| ◆ Recombinant Proteins | ||
| IMMT-2710R | Recombinant Rat IMMT Protein, His (Fc)-Avi-tagged | +Inquiry |
| IMMT-4530M | Recombinant Mouse IMMT Protein, His (Fc)-Avi-tagged | +Inquiry |
| IMMT-016H | Recombinant Human inner membrane protein, mitochondrial Protein, His tagged | +Inquiry |
| IMMT-3054R | Recombinant Rat IMMT Protein | +Inquiry |
| IMMT-8192M | Recombinant Mouse IMMT Protein | +Inquiry |
| ◆ Cell & Tissue Lysates | ||
| IMMT-5216HCL | Recombinant Human IMMT 293 Cell Lysate | +Inquiry |
A CHCHD6–APP axis connects amyloid and mitochondrial pathology in Alzheimer’s disease
Journal: Acta Neuropathologica PubMed ID: 36104602 Data: 2022/9/14
Authors: Yutong Shang, Xiaoyan Sun, Xin Qi
Article Snippet:The Alexa 488/568/405/633 fluorescent secondary antibodies were from Invitrogen.The Alexa 488/568/405/633 fluorescent secondary antibodies were from Invitrogen.. CHCHD3 (CHCHD3-195H) and Mitofilin (IMMT-838H) recombinant proteins were from Creative BioMart (Shirley, NY, USA).. CHCHD6 recombinant protein (TP302975) was from Origene (Rockville, MD, USA).CHCHD6 recombinant protein (TP302975) was from Origene (Rockville, MD, USA).
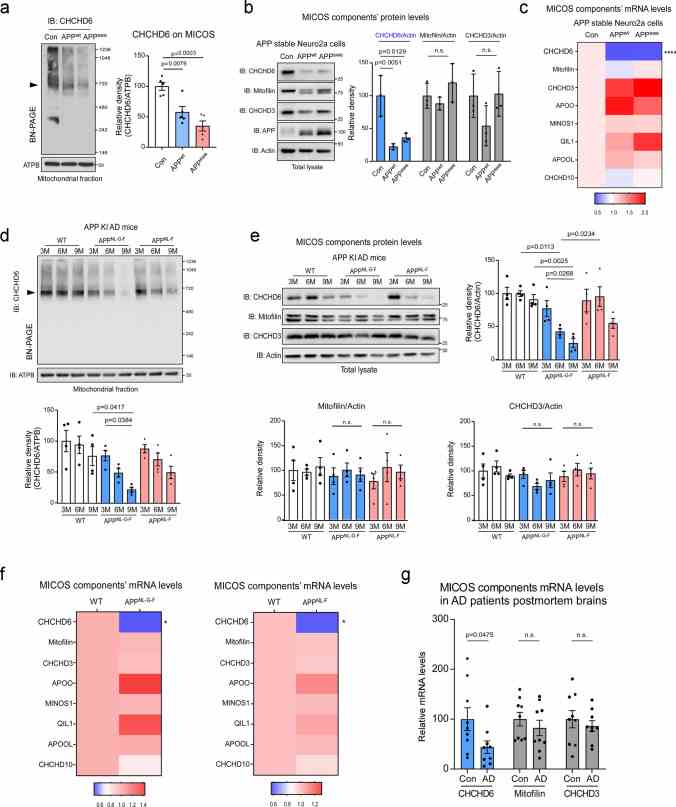
CHCHD6 selectively decreases at transcription level in AD models. a Mitochondrial fractions were isolated from APP stable Neuro2a cells and subjected to Blue Native PAGE (BN-PAGE) analysis followed by western blotting (WB). MICOS complex level was detected with antibody against CHCHD6. ATPB was analyzed by SDS-PAGE followed by WB, using as a loading control. Left: representative blots from 5 independent experiments. Right: relative density of CHCHD6-immunoreactive band around 720 kDa in contrast to ATPB. b Total lysates harvested from APP stable Neuro2a cells were subjected to WB with the indicated antibodies. Left: representative blots from 3 independent experiments. Right: relative density of CHCHD6,
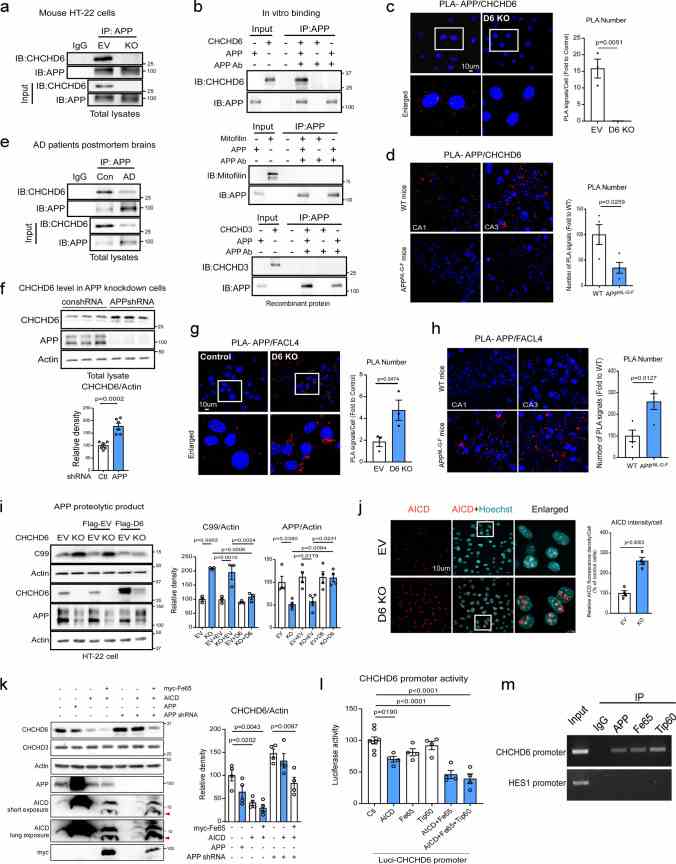
CHCHD6 and APP are interdependent to regulate each other. a . The total protein lysates of control and CHCHD6 KO HT-22 cells were subjected to immunoprecipitation (IP) with anti-APP antibody, followed by WB. Shown blots are representative of three independent experiments. b APP recombinant protein (500 ng) was incubated with either CHCHD6,
Not For Human Consumption!
Inquiry
- Reviews (0)
- Q&As (0)


Ask a Question for All IMMT Products
Required fields are marked with *
My Review for All IMMT Products
Required fields are marked with *