


Recombinant Human NEU1, His-tagged 
| Cat.No. : | NEU1-156H |
| Product Overview : | Recombinant Human Sialidase-1 is produced by our mammalian expression system in human cells. The target protein is expressed with sequence (Glu48-Leu415) of Human NEU1 fused with a 6His tag at the C-terminus. |
| Availability | July 18, 2026 |
| Unit | |
| Price | |
| Qty |
- Specification
- Gene Information
- Related Products
- Citation
- Download
| Species : | Human |
| Source : | HEK293 |
| Tag : | His |
| Description : | Sialidase-1 belongs to the N-acetyl-a neuraminidase family. Sialidase-1 is expressed in many tissues; it is highly expressed in the pancreas, and weakly expressed in the brain. Sialidase-1 is a lysosomal enzyme, which cleaves terminal sialic acid residues from substrates such as glycoproteins and glycolipids. Deficiencies in the human enzyme Sialidase-1 leads to sialidosis, a rare lysosomal storage disease. Sialidase-1 has been shown to interact with Cathepsin A (protective protein), β-galactosidase and N-acetylgalactosamine-6-sulfate sulfatase in a multienzyme complex. |
| AA Sequence : | ENDFGLVQPLVTMEQLLWVSGRQIGSVDTFRIPLITATPRGTLLAFAEARKMSSSDEGAKFIALR RSMDQGSTWSPTAFIVNDGDVPDGLNLGAVVSDVETGVVFLFYSLCAHKAGCQVASTMLVWSKDD GVSWSTPRNLSLDIGTEVFAPGPGSGIQKQREPRKGRLIVCGHGTLERDGVFCLLSDDHGASWRY GSGVSGIPYGQPKQENDFNPDECQPYELPDGSVVINARNQNNYHCHCRIVLRSYDACDTLRPRDV TFDPELVDPVVAAGAVVTSSGIVFFSNPAHPEFRVNLTLRWSFSNGTSWRKETVQLWPGPSGYSS LATLEGSMDGEEQAPQLYVLYEKGRNHYTESISVAKISVYGTLVDHHHHHH |
| Endotoxin : | Less than 0.1 ng/μg (1 IEU/μg). |
| Purity : | Greater than 95% as determined by reducing SDS-PAGE. |
| Publications : |
| Gene Name | NEU1 sialidase 1 (lysosomal sialidase) [ Homo sapiens ] |
| Official Symbol | NEU1 |
| Synonyms | NEU1; sialidase 1 (lysosomal sialidase); NEU; sialidase-1; G9 sialidase; exo-alpha-sialidase; lysosomal sialidase; acetylneuraminyl hydrolase; N-acetyl-alpha-neuraminidase 1; NANH; SIAL1; FLJ93471; |
| Gene ID | 4758 |
| mRNA Refseq | NM_000434 |
| Protein Refseq | NP_000425 |
| MIM | 608272 |
| UniProt ID | Q99519 |
| Chromosome Location | 6p21 |
| Pathway | Glycosphingolipid metabolism, organism-specific biosystem; Lysosome, organism-specific biosystem; Lysosome, conserved biosystem; Metabolism, organism-specific biosystem; Metabolism of lipids and lipoproteins, organism-specific biosystem; Other glycan degradation, organism-specific biosystem; Other glycan degradation, conserved biosystem; |
| Function | exo-alpha-(2->3)-sialidase activity; exo-alpha-(2->6)-sialidase activity; exo-alpha-(2->8)-sialidase activity; exo-alpha-sialidase activity; hydrolase activity, acting on glycosyl bonds; |
| ◆ Recombinant Proteins | ||
| Neu1-3272M | Recombinant Mouse Neu1 protein, His-tagged | +Inquiry |
| NEU1-4014Z | Recombinant Zebrafish NEU1 | +Inquiry |
| NEU1-1501H | Recombinant Human NEU1 Protein, His (Fc)-Avi-tagged | +Inquiry |
| Neu1-5480M | Recombinant Mouse Neu1 protein, His-tagged | +Inquiry |
| NEU1-4686H | Recombinant Human NEU1 Protein (Ala47-Leu415), C-His tagged | +Inquiry |
| ◆ Cell & Tissue Lysates | ||
| NEU1-3871HCL | Recombinant Human NEU1 293 Cell Lysate | +Inquiry |
Neuraminidases 1 and 3 Trigger Atherosclerosis by Desialylating Low‐Density Lipoproteins and Increasing Their Uptake by Macrophages
Journal: Journal of the American Heart Association: Cardiovascular and Cerebrovascular Disease PubMed ID: 33554615 Data: 2021/2/6
Authors: Ekaterina P. Demina, Victoria Smutova, Alexey V. Pshezhetsky
Article Snippet:Because production of active recombinant NEU1 requires mammalian cells, the human enzyme was expressed as a His‐tagged protein in HEK293 cells, transduced with a CathA‐IRES‐NEU1 lentivirus, and partially purified by affinity chromatography using HisPur Ni‐NTA (Thermo Fisher Scientific; 88222).Because production of active recombinant NEU1 requires mammalian cells, the human enzyme was expressed as a His‐tagged protein in HEK293 cells, transduced with a CathA‐IRES‐NEU1 lentivirus, and partially purified by affinity chromatography using HisPur Ni‐NTA (Thermo Fisher Scientific; 88222).. For lectin blotting experiments, commercially available purified recombinant human NEU1 (NEU1‐156H; Creative BioMart) was used.. Neuraminidase activity and inhibition assays were performed using 2′‐(4‐methylumbelliferyl)‐α‐ d ‐N‐acetylneuraminic acid and GM3 ganglioside as substrates, as described.Neuraminidase activity and inhibition assays were performed using 2′‐(4‐methylumbelliferyl)‐α‐ d ‐N‐acetylneuraminic acid and GM3 ganglioside as substrates, as described.
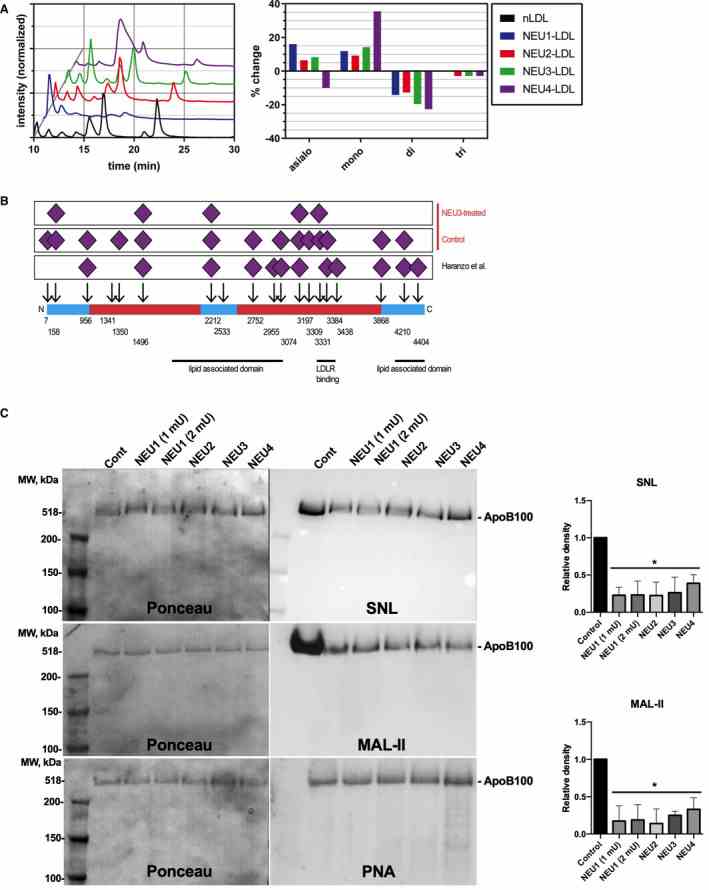
A , Liquid chromatography–mass spectrometry (LC‐MS) profiles of ApoB N‐glycans from neuraminidase‐treated and untreated human LDL. Chromatograms of fluorescently labeled N‐glycans cleaved from ApoB of human LDL from a healthy donor (black) and of LDL treated with recombinant human neuraminidase 1
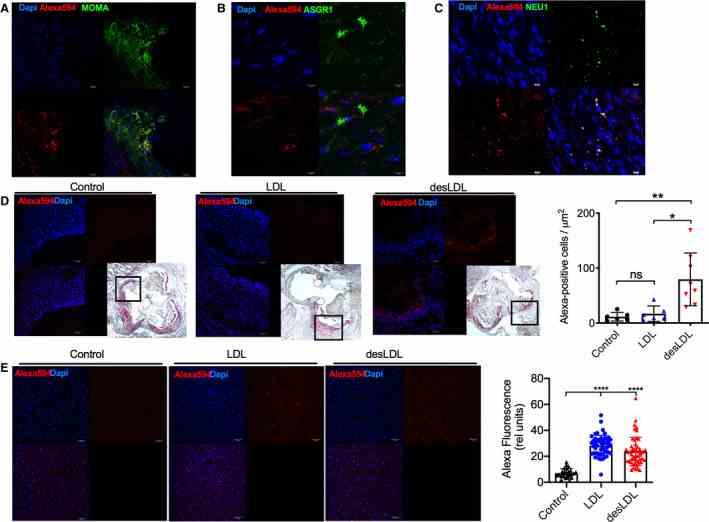
A through D , Accumulation of native LDL and desialylated LDL (desLDL) in the aortic root lesions of 16‐week‐old Apoe ?/? mice was studied 6 hours after systemic injection of 200 μg of labeled LDL or desLDL. Aortic root sections were stained with monoclonal anti–monocyte+macrophage antibody (MOMA‐2) ( A ), polyclonal rabbit antibody against ASGR1 ( B ), or monoclonal rabbit antibody against neuraminidase 1
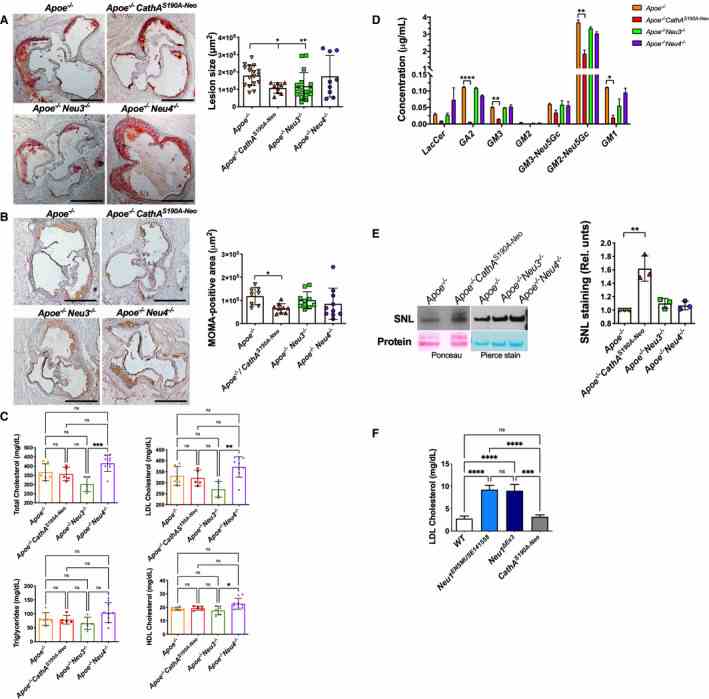
A , Size of fatty streaks is reduced in the aortic root of Apoe ?/? mice deficient in
Not For Human Consumption!
Inquiry
- Reviews (0)
- Q&As (0)


Ask a Question for All NEU1 Products
Required fields are marked with *
My Review for All NEU1 Products
Required fields are marked with *