


Recombinant Human CHAT HEK293T cell lysate
| Cat.No. : | CHAT-175HCL |
| Product Overview : | Human CHAT derived in Human HEK293T cell line. The cell lysate is provided in RIPA buffer. |
- Specification
- Gene Information
- Related Products
- Citation
- Download
| Species : | Human |
| Source : | HEK293 |
| Tag : | DDK&Myc |
| Description : | This gene encodes an enzyme which catalyzes the biosynthesis of the neurotransmitter acetylcholine. This gene product is a characteristic feature of cholinergic neurons, and changes in these neurons may explain some of the symptoms of Alzheimer disease. Mutations in this gene are associated with congenital myasthenic syndrome associated with episodic apnea. Multiple transcript variants encoding different isoforms have been found for this gene, and some of these variants have been shown to encode more than one isoform. |
| Molecular Mass : | 82.4 kDa |
| Components : | 1 vial of 100 µg gene specific transient over-expression cell lysate in RIPA buffer;1 vial of 100 µg empty vector transfected control cell lysate in RIPA buffer;1 vial of 250ul 2xSDS Sample Buffer (4% SDS, 125mM Tris-HCl pH6.8, 10% Glycerol, 0.002% Bromphenol blue, 100mM DTT). |
| Preparation method : | HEK293T cells in 10-cm dishes were transiently transfected with MegaTran Transfection Reagent and 5ug TrueORF cDNA plasmid. Transfected cells were cultured for 48hrs before collection. The cells were lysed in modified RIPA buffer (25mM Tris-HCl pH7.6, 150mM NaCl, 1% NP-40, 1mM EDTA, 1xProteinase inhibitor cocktail mix, 1mM PMSF and 1mM Na3VO4), and then centrifuged to clarify the lysate. Protein concentration was measured by BCA kit. Cell lysates were aliquoted and stored at -20 centigrade before shipping. |
| Gene Name | CHAT choline O-acetyltransferase [ Homo sapiens ] |
| Official Symbol | CHAT |
| Synonyms | CHAT; choline O-acetyltransferase; choline acetyltransferase; choline acetylase; acetyl CoA:choline O-acetyltransferase; CMS1A; CMS1A2; CHOACTASE; |
| Gene ID | 1103 |
| mRNA Refseq | NM_020549 |
| Protein Refseq | NP_065574 |
| MIM | 118490 |
| UniProt ID | P28329 |
| Chromosome Location | 10q11.2 |
| Pathway | Acetylcholine Neurotransmitter Release Cycle, organism-specific biosystem; Acetylcholine Synthesis, organism-specific biosystem; Biogenic Amine Synthesis, organism-specific biosystem; Cholinergic synapse, organism-specific biosystem; Glycerophospholipid metabolism, organism-specific biosystem; Glycerophospholipid metabolism, conserved biosystem; Neuronal System, organism-specific biosystem; |
| Function | choline O-acetyltransferase activity; choline binding; transferase activity, transferring acyl groups; |
| ◆ Recombinant Proteins | ||
| CHAT-174H | Recombinant Human CHAT | +Inquiry |
| CHAT-176H | Recombinant Human CHAT protein, GST-tagged | +Inquiry |
| Chat-1836R | Recombinant Rat Choline O-Acetyltransferase | +Inquiry |
| CHAT-6178C | Recombinant Chicken CHAT | +Inquiry |
| CHAT-175HCL | Recombinant Human CHAT HEK293T cell lysate | +Inquiry |
Epigenetic quantification of immunosenescent CD8 + TEMRA cells in human blood
Journal: Aging Cell PubMed ID: 35397197 Data: 2022/4/9
Authors: Ahto Salumets, Liina Tserel, P?rt Peterson
Article Snippet:Two fragments of immunodominant regions of CMV antigen pp150 were cloned into pNanoLuc vector, and LIPS was performed as reported earlier (Haljasm?gi et al., ).Two fragments of immunodominant regions of CMV antigen pp150 were cloned into pNanoLuc vector, and LIPS was performed as reported earlier (Haljasm?gi et al., ).. The HEK293 cell lysates containing NanoLuc‐fusion proteins (0.5–1 × 10 6 luminescence units; LU) were incubated with plasma samples and Protein G Sepharose beads (Creative BioMart) to capture antibodies (in 1:40 dilution).. After washing, the substrate was added (Nano‐Glo? Luciferase Substrate, Promega), and luminescence was measured in VICTOR X Reader (PerkinElmer Life Sciences).After washing, the substrate was added (Nano‐Glo? Luciferase Substrate, Promega), and luminescence was measured in VICTOR X Reader (PerkinElmer Life Sciences).
Longitudinal proteomic profiling reveals increased early inflammation and sustained apoptosis proteins in severe COVID-19
Journal: Scientific Reports PubMed ID: 33239683 Data: 2020/11/25
Authors: Liis Haljasm?gi, Ahto Salumets, P?rt Peterson
Article Snippet:SARS-CoV-2 S (S1 aa 1–680 and S2 aa 820–1211), S1 RBD (aa 329–538), and N (aa 2–419) fragments were cloned into pNanoLuc vector, and LIPS was performed as reported .SARS-CoV-2 S (S1 aa 1–680 and S2 aa 820–1211), S1 RBD (aa 329–538), and N (aa 2–419) fragments were cloned into pNanoLuc vector, and LIPS was performed as reported .. The HEK293 cell lysates containing NanoLuc‐fusion proteins (0.5—1 × 10 6 luminescence units; LU) were incubated with plasma samples and Protein G Sepharose beads (Creative BioMart) to capture antibodies (in 1:40 dilution).. After washing, substrate was added (Nano-Glo? Luciferase Substrate, Promega), and luminescence was measured in VICTOR X Reader (PerkinElmer Life Sciences).After washing, substrate was added (Nano-Glo? Luciferase Substrate, Promega), and luminescence was measured in VICTOR X Reader (PerkinElmer Life Sciences).
Supraphysiological levels of GDF 11 induce striated muscle atrophy
Journal: EMBO Molecular Medicine PubMed ID: 28270449 Data: 2017/3/7
Authors: David W Hammers, Melissa Merscham‐Banda, H Lee Sweeney
Article Snippet:At day 6, myotube cultures were treated with various doses of the recombinant ligands (listed above) for 1 h ( n = 4), and SMAD phosphorylation was assayed as mentioned above.At day 6, myotube cultures were treated with various doses of the recombinant ligands (listed above) for 1 h ( n = 4), and SMAD phosphorylation was assayed as mentioned above.. For ActRIIB antibody (anti‐ActRIIB) assays, HEK293T cells were treated with 0 or 100 nM anti‐ActRIIB (Creative BioMart, murinized version of BYM338 antibody; Lach‐Trifilieff et al , ) overnight prior to ligand addition, lysing, and AlphaLISA evaluation, as described above.
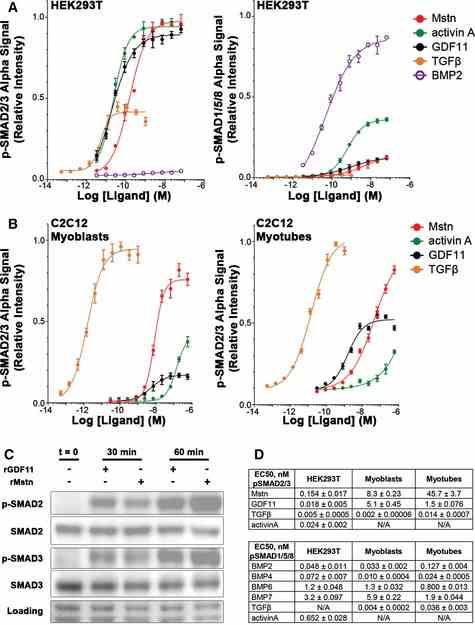
Relative p‐SMAD2/3 (left) and p‐SMAD1/5/8 (right) response, evaluated by AlphaLISA signal, of
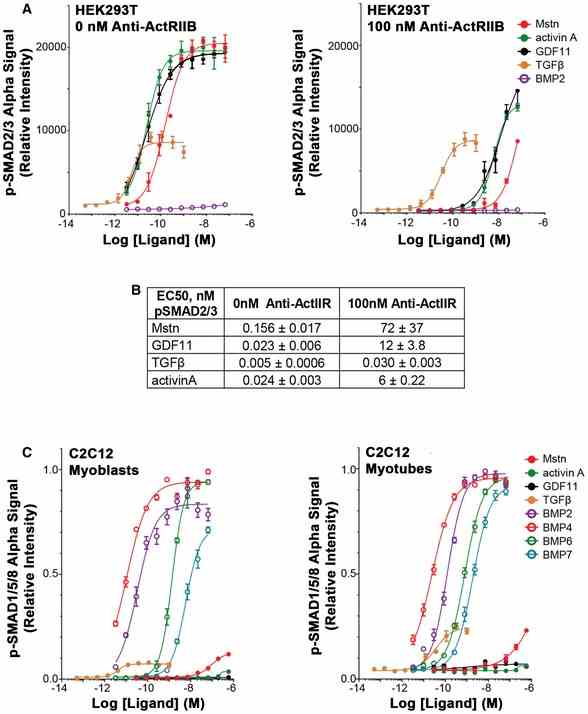
A, B Significant shifts in the response of
Not For Human Consumption!
Inquiry
- Reviews (0)
- Q&As (0)


Ask a Question for All CHAT Products
Required fields are marked with *
My Review for All CHAT Products
Required fields are marked with *