


Active Recombinant Full Length Human STAT3, His-tagged 
| Cat.No. : | STAT3-29823TH |
| Product Overview : | Recombinant full length Human STAT3 with His tag, Predicted MWt 89 kDa. |
| Availability | July 18, 2026 |
| Unit | |
| Price | |
| Qty |
- Specification
- Gene Information
- Related Products
- Citation
- Download
| Species : | Human |
| Source : | E.coli |
| Tag : | His |
| Description : | The protein encoded by this gene is a member of the STAT protein family. In response to cytokines and growth factors, STAT family members are phosphorylated by the receptor associated kinases, and then form homo- or heterodimers that translocate to the cell nucleus where they act as transcription activators. This protein is activated through phosphorylation in response to various cytokines and growth factors including IFNs, EGF, IL5, IL6, HGF, LIF and BMP2. This protein mediates the expression of a variety of genes in response to cell stimuli, and thus plays a key role in many cellular processes such as cell growth and apoptosis. The small GTPase Rac1 has been shown to bind and regulate the activity of this protein. PIAS3 protein is a specific inhibitor of this protein. Three alternatively spliced transcript variants encoding distinct isoforms have been described. |
| Conjugation : | HIS |
| Tissue specificity : | Heart, brain, placenta, lung, liver, skeletal muscle, kidney and pancreas. |
| Biological activity : | 1 unit equals 1 nanogram of purified protein. |
| Form : | Liquid |
| Purity : | >95% by SDS-PAGE |
| Storage buffer : | Preservative: NoneConstituents: 20% Glycerol, 20mM Tris HCl, 100mM Potassium chloride, 1mM DTT, 0.2mM EDTA, pH 7.9 |
| Storage : | Shipped on dry ice. Upon delivery aliquot and store at -80oC. Avoid freeze / thaw cycles. |
| Sequence Similarities : | Belongs to the transcription factor STAT family.Contains 1 SH2 domain. |
| Full Length : | Full L. |
| Publications : |
|
| Gene Name | STAT3 signal transducer and activator of transcription 3 (acute-phase response factor) [ Homo sapiens ] |
| Official Symbol | STAT3 |
| Synonyms | STAT3; signal transducer and activator of transcription 3 (acute-phase response factor); signal transducer and activator of transcription 3; APRF; |
| Gene ID | 6774 |
| mRNA Refseq | NM_003150 |
| Protein Refseq | NP_003141 |
| MIM | 102582 |
| Uniprot ID | P40763 |
| Chromosome Location | 17q21 |
| Pathway | Acute myeloid leukemia, organism-specific biosystem; Acute myeloid leukemia, conserved biosystem; Adipocytokine signaling pathway, organism-specific biosystem; Adipocytokine signaling pathway, conserved biosystem; Adipogenesis, organism-specific biosystem; |
| Function | CCR5 chemokine receptor binding; DNA binding; calcium ion binding; glucocorticoid receptor binding; ligand-regulated transcription factor activity; |
| ◆ Recombinant Proteins | ||
| STAT3-4148H | Recombinant Human STAT3 Protein, His (Fc)-Avi-tagged | +Inquiry |
| STAT3-5778R | Recombinant Rat STAT3 Protein | +Inquiry |
| STAT3-2172H | Recombinant Human STAT3 | +Inquiry |
| STAT3-335H | Recombinant Human STAT3 protein, His/MBP-tagged | +Inquiry |
| Stat3-2107R | Recombinant Rat Stat3 Protein, His-tagged | +Inquiry |
| ◆ Cell & Tissue Lysates | ||
| STAT3-1417HCL | Recombinant Human STAT3 293 Cell Lysate | +Inquiry |
| STAT3-301HKCL | Human STAT3 Knockdown Cell Lysate | +Inquiry |
| STAT3-1418HCL | Recombinant Human STAT3 293 Cell Lysate | +Inquiry |
An FDA-Approved Antifungal, Ketoconazole, and Its Novel Derivative Suppress tGLI1-Mediated Breast Cancer Brain Metastasis by Inhibiting the DNA-Binding Activity of Brain Metastasis-Promoting Transcription Factor tGLI1
Journal: Cancers Data: 2022/8/31
Authors: Daniel Doheny, Sara Manore, Derek Radisky
Article Snippet:Approximately 600 ng of recombinant STAT3 (Creative BioMart, STAT3-29823TH) (Shirley, NY, USA), GLI1 (Creative BioMart, GLI1-312H), or N-tGLI1 protein was mixed with 5X binding buffer (50 mM Tris pH 7.5, 50 mM NaCl, 200 mM KCl, 5 mM MgCl 2 , 10 mM EDTA, 5 mM DTT, 250 μg/mL BSA, 25% glycerol), 50 ng/μL poly dI·dC (Sigma P4929), and 5 pmol 6FAM-labeled dsDNA oligo (Integrated DNA Technologies, Coralville, IA, USA) in a total reaction volume of 20 μL.. The oligos were ordered as the dsDNA from IDT with the sequences /56-FAM/CGAAGA GACCACCCA GGTAGCT and /56-FAM/AGCTACC TGGGTGGTC TCTTCG; the GLI1 consensus binding sequence is underlined.The oligos were ordered as the dsDNA from IDT with the sequences /56-FAM/CGAAGA GACCACCCA GGTAGCT and /56-FAM/AGCTACC TGGGTGGTC TCTTCG; the GLI1 consensus binding sequence is underlined.
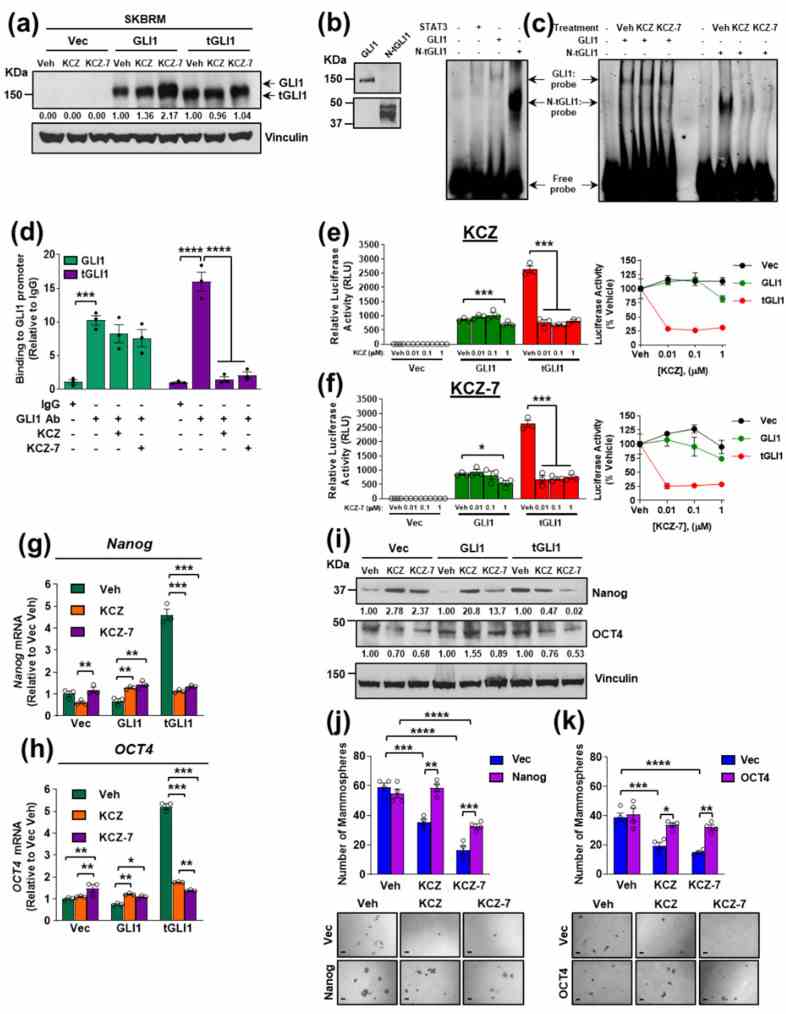
KCZ and the novel derivative KCZ-7 inhibit tGLI1 transcriptional activity leading to downregulation of validated tGLI1-mediated stemness genes Nanog and OCT4 . ( a ) Representative Western blots of GLI1 and tGLI1 expression in isogenic SKBRM cell lines following 24 h treatment with vehicle, 1 μM KCZ, or 1 μM KCZ-7. The same membrane was probed to assess the loading control. ( b ) Western blots of recombinant GLI1 and N-tGLI1 (left). A tGLI1-selective Ab was used to detect tGLI1. Binding of recombinant GLI1 and N-tGLI1 to a dsDNA oligonucleotide containing the consensus GLI1/tGLI1-binding site (right).
Not For Human Consumption!
Inquiry
- Reviews (0)
- Q&As (0)


Ask a Question for All STAT3 Products
Required fields are marked with *
My Review for All STAT3 Products
Required fields are marked with *