Recombinant Human Creatine Kinase, Brain

Cat.No. : CKB-195H
Product Overview : Recombinant Human CKBBI produced inPichia Pastorisis a glycosylated polypeptide chain having an identical amino acid sequence compared to the native enzyme, purified under non-denaturing conditions and reacts with polyclonal antibodies to BB Isoenzyme in ELISA. The CKBBI is purified by proprietary chromatographic techniques.
  • Specification
  • Gene Information
  • Related Products
  • Citation
  • Download
Species : Human
Source : P.pastoris
Tag : Non
Description : Creatine Kinase BB is a cytoplasmic enzyme involved in energy homeostasis. The encoded protein reversibly catalyzes the transfer of phosphate between ATP and various phosphogens such as creatine phosphate. It acts as a homodimer in brain as well as in other tissues, and as a heterodimer with a similar muscle isozyme in heart. The encoded protein is a member of the ATP: guanido phosphotransferase protein family. A pseudogene of this gene has been characterized.
Physical Appearance : Sterile Filtered colourless liquid formulation.
Formulation : The protein (2.2 mg/ml) contains 10mM Bis-Tris-HCl pH-6.2, 50% glycerol, 0.5mM EDTA and 0.5mM DTT.
Stability : CKBBI although stable at 15°C for 7 days, should be stored desiccated below -18°C. Please prevent freeze-thaw cycles.
Purity : Greater than 95.0% as determined by: (a) Analysis by RP-HPLC. (b) Analysis by SDS-PAGE.
Biological Activity : The biological activity measured by the enzymatic activity of Creatine phosphokinase procedure No.45-UV, 1IU-1 µmole creatine phosphate was 500 IU/mg at 37°C.
Gene Name CKB creatine kinase, brain [ Homo sapiens ]
Synonyms CKB; creatine kinase, brain; B-CK; CKBB; creatine kinase-B; EC 2.7.3.2
Gene ID 1152
mRNA Refseq NM_001823
Protein Refseq NP_001814
MIM 123280
UniProt ID P12277
Chromosome Location 14q32.3
Pathway Arginine and proline metabolism; Metabolic pathways; Metabolism of amino acids
Function ATP binding; creatine kinase activity; nucleotide binding; protein binding

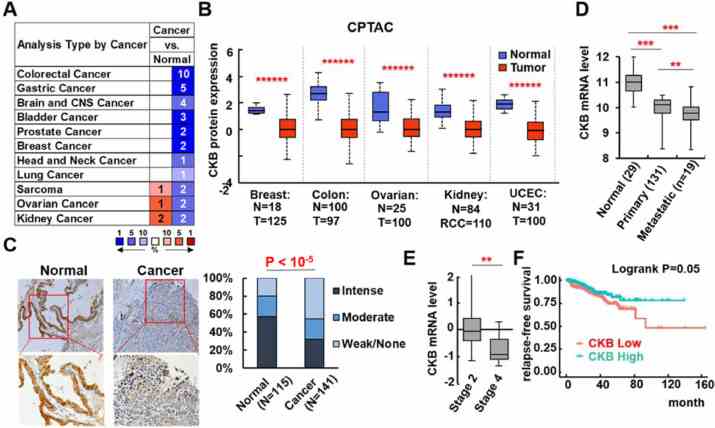
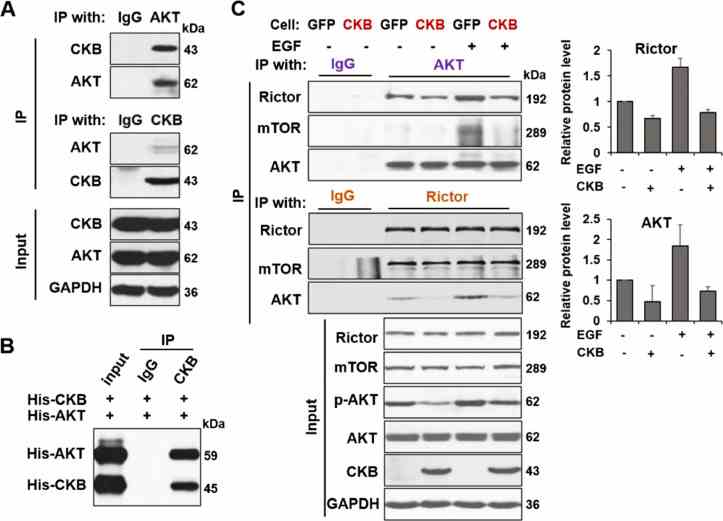
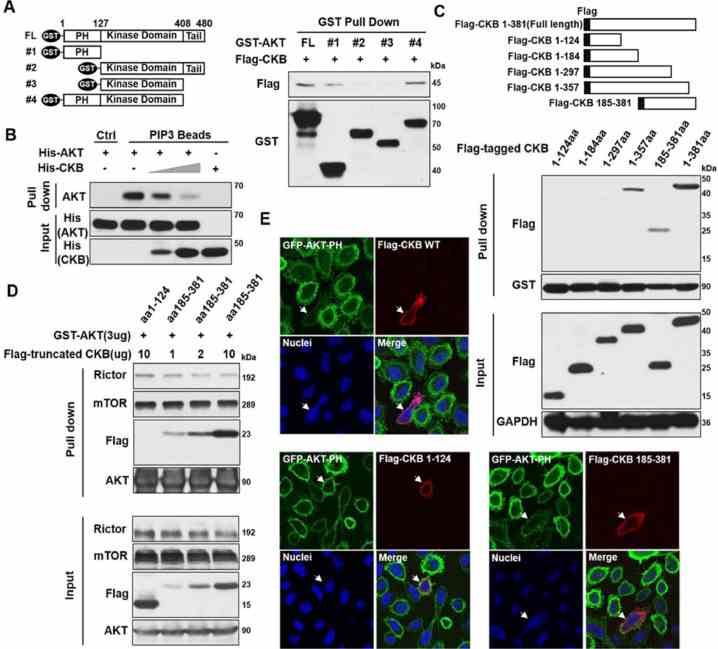
CKB inhibits epithelial-mesenchymal transition and prostate cancer progression by sequestering and inhibiting AKT activation

Journal: Neoplasia (New York, N.Y.)    PubMed ID: 34706306    Data: 2021/10/24

Authors: Zheng Wang, Mohit Hulsurkar, Wenliang Li

Article Snippet:His-tagged recombinant human AKT1 protein (#PR3878D, Invitrogen) were incubated with 0, 1 or 2ug his-tagged recombinant human CKB protein (#495H, Creative BioMart) at 4°C for 2 h on a rotating mixer.. 40μL of PIP3 or control resin beads slurry (#PB345a, Echelon) were washed with PBS and added to each tube.40μL of PIP3 or control resin beads slurry (#PB345a, Echelon) were washed with PBS and added to each tube.

CKB is downregulated in human solid tumors, which is associated with poor prognosis. (A) CKB mRNA expression in normal vs tumor comparisons of various cancer types from Oncomine.org website. Significance thresholds are: P ≤ 1 × 10 ?4 , fold change ≥2, and gene rank top 10%. Red signifies over-expression and blue represents under-expression in tumors. Intensities of color signify the best ranks of CKB in the analyses. The numbers represent the numbers of analyses that meet the thresholds. (B) CKB protein expression in normal and tumor samples, and the P values, were from the CPTAC database, obtained through UALCAN. (C) CKB protein expression was analyzed in prostate normal and tumor tissue microarray by immunohistochemistry. Staining was scored for each sample, and percentage of weak, moderate or intense CKB staining in normal and tumor samples was shown on the right. P value was from Chi Square Test. (D-F) CKB mRNA expression was analyzed in Taylor_Prostate dataset (D), and in TCGA prostate cancer dataset for tumor stage (stage 2, n = 186 vs stage 4, n = 11) (E), and biochemical relapse (BCR) free survival time (F). ** P < 0.01, *** P < 0.001 were from 2-sided t test. In KM survival analysis (F), patients were categorized as CKB Low or High based on the ROC curve method, and the P value was from Logrank test (GraphPad Prism) (color version of figure is available online).

CKB is downregulated in human solid tumors, which is associated with poor prognosis. (A) CKB mRNA expression in normal vs tumor comparisons of various cancer types from Oncomine.org website. Significance thresholds are: P ≤ 1 × 10 ?4 , fold change ≥2, and gene rank top 10%. Red signifies over-expression and blue represents under-expression in tumors. Intensities of color signify the best ranks of CKB in the analyses. The numbers represent the numbers of analyses that meet the thresholds. (B) CKB protein expression in normal and tumor samples, and the P values, were from the CPTAC database, obtained through UALCAN. (C) CKB protein expression was analyzed in prostate normal and tumor tissue microarray by immunohistochemistry. Staining was scored for each sample, and percentage of weak, moderate or intense CKB staining in normal and tumor samples was shown on the right. P value was from Chi Square Test. (D-F) CKB mRNA expression was analyzed in Taylor_Prostate dataset (D), and in TCGA prostate cancer dataset for tumor stage (stage 2, n = 186 vs stage 4, n = 11) (E), and biochemical relapse (BCR) free survival time (F). ** P < 0.01, *** P < 0.001 were from 2-sided t test. In KM survival analysis (F), patients were categorized as CKB Low or High based on the ROC curve method, and the P value was from Logrank test (GraphPad Prism) (color version of figure is available online).

CKB interacts with AKT and inhibits AKT activation. (A) CKB and AKT proteins could reciprocally co-immunoprecipitate (co-IP) each other from LNCaP cells. (B) AKT protein was immunoprecipitated by CKB antibody in a mixture of recombinant His-tagged AKT and His-tagged CKB proteins. (C) PC3-GFP and PC3-CKB cells were treated with or without 100ng/ml EGF for 5 min. Endogenous AKT was immunoprecipated from these 2 cell lines using AKT Ab, followed by immunoblotting for Rictor, mTOR and AKT (top). Conversely, endogenous Rictor was immunoprecipated using Rictor Ab, then immunoblot for AKT, mTOR and Rictor (middle). Immunoblotting of the input whole cell lysates was shown in bottom. Fold changes of Rictor and AKT protein levels in the IP samples are plotted, relative to the sample without EGF and without CKB overexpression. The quantification is based on measurements from 2 independent experiments, using ImageJ software.

CKB interacts with AKT and inhibits AKT activation. (A) CKB and AKT proteins could reciprocally co-immunoprecipitate (co-IP) each other from LNCaP cells. (B) AKT protein was immunoprecipitated by CKB antibody in a mixture of recombinant His-tagged AKT and His-tagged CKB proteins. (C) PC3-GFP and PC3-CKB cells were treated with or without 100ng/ml EGF for 5 min. Endogenous AKT was immunoprecipated from these 2 cell lines using AKT Ab, followed by immunoblotting for Rictor, mTOR and AKT (top). Conversely, endogenous Rictor was immunoprecipated using Rictor Ab, then immunoblot for AKT, mTOR and Rictor (middle). Immunoblotting of the input whole cell lysates was shown in bottom. Fold changes of Rictor and AKT protein levels in the IP samples are plotted, relative to the sample without EGF and without CKB overexpression. The quantification is based on measurements from 2 independent experiments, using ImageJ software.

CKB interacts with AKT PH domain through its C-terminal. (A) Schematic of GST-tagged AKT full-length (FL) and truncation mutants (left). The 293T cells were transfected with cDNA vectors for GST-tagged AKT FL or truncations, together cDNA plasmid for Flag-tagged CKB FL protein. GST-tagged AKT proteins were immunoprecipitated by glutathione sepharose beads from co-transfected cells, followed by immunoblotting for Flag and GST (right). (B) PIP3 coated agarose beads were incubated with purified His-tagged AKT (2ug) and/or His-tagged CKB (0, 1 or 2ug) as indicated. PIP3 binding proteins were pulled down. Immunoblots for AKT and CKB were shown. (C) Schematic of Flag-tagged CKB FL and truncation mutants (top). GST-tagged AKT proteins were pull down by glutathione sepharose beads from 293T cells co-transfected with plasmids for GST-tagged AKT FL and Flag-tagged CKB FL or truncations as indicated (middle). Immunoblots on input whole cell lysates are in the bottom. (D) 293T cells were co-transfected with GST-tagged AKT vector and indicated amounts of Flag-tagged CKB truncation vectors. GST-tagged AKT proteins were pull down by glutathione sepharose beads from these cells. Immunoblots for Rictor, mTOR, Flag and AKT were analyzed. (E) Representative immunofluorescence images for GFP-AKT-PH fusion protein (green), Flag-CKB FL protein or Flag-CKB truncations (red) and nuclei (blue). PC3 cells expressing GFP-AKT-PH were transfected with Flag-CKB plasmids. White arrows indicate the PC3 cells transfected with the corresponding CKB full length or truncated cDNA constructs. Untransfected cells in the same wells serve as controls. Additional representative images are in Supplementary Figure S5. Quantifications of GFP-AKT-PH signal ratios on membrane vs cytoplasm in multiple untransfected and transfected cells are presented in Figure S6A. These immunoblotting and IF experiments have been repeated twice, which has yielded same conclusions. Results from a representative experiment are shown (color version of figure is available online).

CKB interacts with AKT PH domain through its C-terminal. (A) Schematic of GST-tagged AKT full-length (FL) and truncation mutants (left). The 293T cells were transfected with cDNA vectors for GST-tagged AKT FL or truncations, together cDNA plasmid for Flag-tagged CKB FL protein. GST-tagged AKT proteins were immunoprecipitated by glutathione sepharose beads from co-transfected cells, followed by immunoblotting for Flag and GST (right). (B) PIP3 coated agarose beads were incubated with purified His-tagged AKT (2ug) and/or His-tagged CKB (0, 1 or 2ug) as indicated. PIP3 binding proteins were pulled down. Immunoblots for AKT and CKB were shown. (C) Schematic of Flag-tagged CKB FL and truncation mutants (top). GST-tagged AKT proteins were pull down by glutathione sepharose beads from 293T cells co-transfected with plasmids for GST-tagged AKT FL and Flag-tagged CKB FL or truncations as indicated (middle). Immunoblots on input whole cell lysates are in the bottom. (D) 293T cells were co-transfected with GST-tagged AKT vector and indicated amounts of Flag-tagged CKB truncation vectors. GST-tagged AKT proteins were pull down by glutathione sepharose beads from these cells. Immunoblots for Rictor, mTOR, Flag and AKT were analyzed. (E) Representative immunofluorescence images for GFP-AKT-PH fusion protein (green), Flag-CKB FL protein or Flag-CKB truncations (red) and nuclei (blue). PC3 cells expressing GFP-AKT-PH were transfected with Flag-CKB plasmids. White arrows indicate the PC3 cells transfected with the corresponding CKB full length or truncated cDNA constructs. Untransfected cells in the same wells serve as controls. Additional representative images are in Supplementary Figure S5. Quantifications of GFP-AKT-PH signal ratios on membrane vs cytoplasm in multiple untransfected and transfected cells are presented in Figure S6A. These immunoblotting and IF experiments have been repeated twice, which has yielded same conclusions. Results from a representative experiment are shown (color version of figure is available online).

Not For Human Consumption!

Inquiry

  • Reviews (0)
  • Q&As (0)

Customer Reviews

Write a review

Ask a Question for All CKB Products

Required fields are marked with *

My Review for All CKB Products

Required fields are marked with *

0
cart-icon