Diet-dependent regulation of TGFβ impairs reparative innate immune responses after demyelination
Journal: Nature metabolism PubMed ID: 33619376 Data: 2021/8/1
Authors: Mar Bosch-Queralt, Ludovico Cantuti-Castelvetri, Mikael Simons
Article Snippet:Generation of recombinant anti-TREM2 antibodies was performed as described in ref. 54 .Generation of recombinant anti-TREM2 antibodies was performed as described in ref. 54 .. Wistar rats were immunized subcutaneously (s.c.) and intraperitoneally (i.p.) with a mixture of 70 μg recombinant his-tagged mouse Trem2 protein (aa19-171, Creative BioMart) in 500 μL PBS, 5 nmol CpG2006 (TIB MOLBIOL) and 500 μL incomplete Freund’s adjuvant.. Fusion of the myeloma cell line P3X63-Ag8.653 with the rat immune spleen cells was performed.Fusion of the myeloma cell line P3X63-Ag8.653 with the rat immune spleen cells was performed.
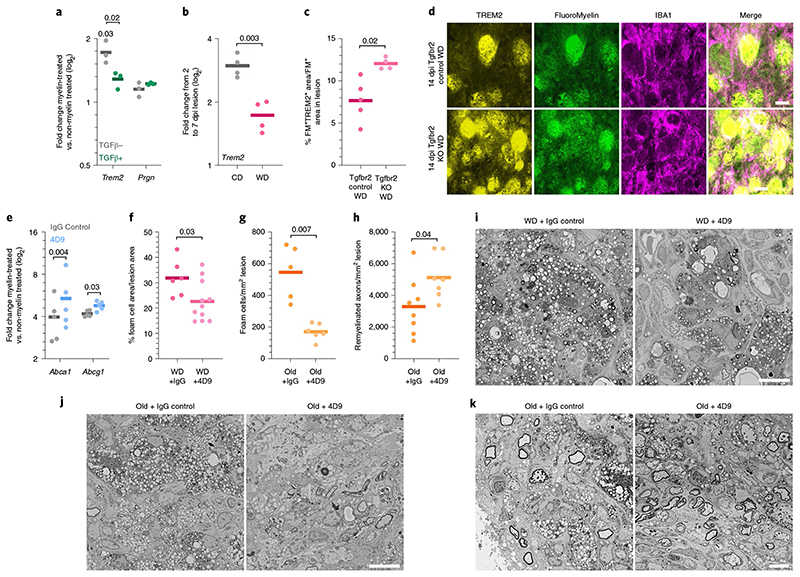
a, Quantification of the induction of the Trem2 and Prgn expression by myelin intake (P for Trem2 induction = 0.03, one sample f-test) and the influence of TGFβ on :his induction (P for Trem2 = 0.02, two-tailed Welch’s f-test). No significant differences were observed for Prgn. b, Quantification of the induction of Trem2 expression in demyelinated lesions from 2 to 7 dpi (two-tailed Welch’s f-test). c, Quantification of TREM2 levels in FluoroMyelin+ (FM+) cells n the demyelinated lesions at 14dpi (two-tailed Welch’s f-test). d, Images of the demyelinated lesions at 14dpi demonstrating TREM2 expression in myelin-loaded IBA1+ cells. Scale bar, 20μm. e, Quantification of the expression change in Abca1 and Abcg1 upon myelin intake in BMDMs incubated with 4D9 or its isotype control (paired f-test). f, Quantification of lesion area occupied by foam cells at 14dpi in WD-fed mice treated intraperitoneally with 100 mg/kg (body weight) of 4D9 antibody or its isotype control (two-tailed Welch’s f-test). g, Quantification of the number of foam cells per mm2 of esion at 14 dpi in 12-month-old mice treated intraperitoneally with 100 mg/kg (body weight) 4D9 antibody or its isotype control (two-tailed Welch’s :-test). h, Quantification of the number of remyelinated axons per mm2 of lesion at 21dpi in 12-month-old mice treated intraperitoneally with 100 mg/kg fbody weight) of 4D9 antibody or its isotype control (two-tailed Welch’s f-test). i, Electron microscopy images of the demyelinated lesions in the spinal :ord at 14 dpi exemplifying foam-cell accumulation within the lesion. Scale bar, 10 μm. j, Electron microscopy images of the demyelinated lesions in the spinal cord at 14dpi exemplifying accumulation of foam cells within the lesion. Scale bar, 10μm. k, Electron microscopy images of the demyelinated lesions n the spinal cord at 21 dpi exemplifying remyelinated axons. Scale bar, 10μm. Pvalues below 0.1 and n numbers are indicated in the figure. Solid lines in he graphs indicate the mean.
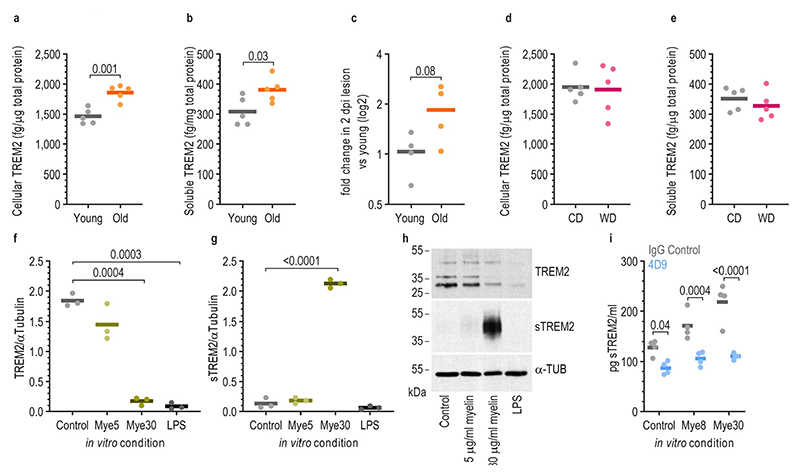
a,d, Quantification using ELISA of cellular TREM2 in the unlesioned brain of old (12-months old) and young (3-months old) mice (a) and of CD- and WD-fed mice (d) (two-tailed Welch’s t-test). b,e, Quantification using ELISA of soluble TREM2 in the unlesioned brain old and young mice (b) and of CD- and WD-fed mice (e) (two-tailed Welch’s t-test). c, Change in expression of Trem2 in the demyelinated lesions of old mice at 2 dpi when compared to young mice (two-tailed Welch’s t-test). f,g, Quantification of the band density in Western blots of TREM2-labelled (f) and sTREM2-labelled (g) bands normalized by the density of the bands labelled by α-TUBULIN (α-TUB). Microglia were treated with myelin for 24 hours (one-way Brown-Forsythe and Welch ANOVA tests with multiple comparisons corrected by Dunnett T3 test). h, Example images of the Western blots used for quantification of TREM2 and sTREM2 densities. Molecular weight ladders are indicated on the left side. i, Quantification by ELISA of the amounts of sTREM2 found in the media in different conditions. Microglia were treated with 20μg/mL of 4D9 antibody or IgG isotype control for 16hours, followed by 24hours of myelin treatment (two-tailed Welch’s t-test). P-values and n numbers are indicated in the figure. Solid lines in the graphs indicate the mean. dpi: days post injection, CD: control diet, WD: Western diet, sTREM2: soluble TREM2, Mye5: 5μg/mL myelin treatment, Mye8: 8μg/mL myelin treatment, Mye30: 30μg/mL myelin treatment, 4D9: TREM2 enhancing antibody.
Enhancing protective microglial activities with a dual function TREM 2 antibody to the stalk region
Journal: EMBO Molecular Medicine PubMed ID: 32154671 Data: 2020/3/10
Authors: Kai Schlepckow, Kathryn M Monroe, Christian Haass
Article Snippet:Eight‐month‐old female Wistar rats were immunized subcutaneously (s.c.) and intraperitoneally (i.p.) with a mixture of 70 μg recombinant his‐tagged mouse Trem2 protein (aa19–171, Creative BioMart) in 500 μl PBS, 5 nmol CpG2006 (TIB MOLBIOL, Berlin, Germany), and 500 μl Incomplete Freund's adjuvant.. After 6 weeks, a boost without Freund's adjuvant was given i.p. and s.c. 3 days before fusion.After 6 weeks, a boost without Freund's adjuvant was given i.p. and s.c. 3 days before fusion.
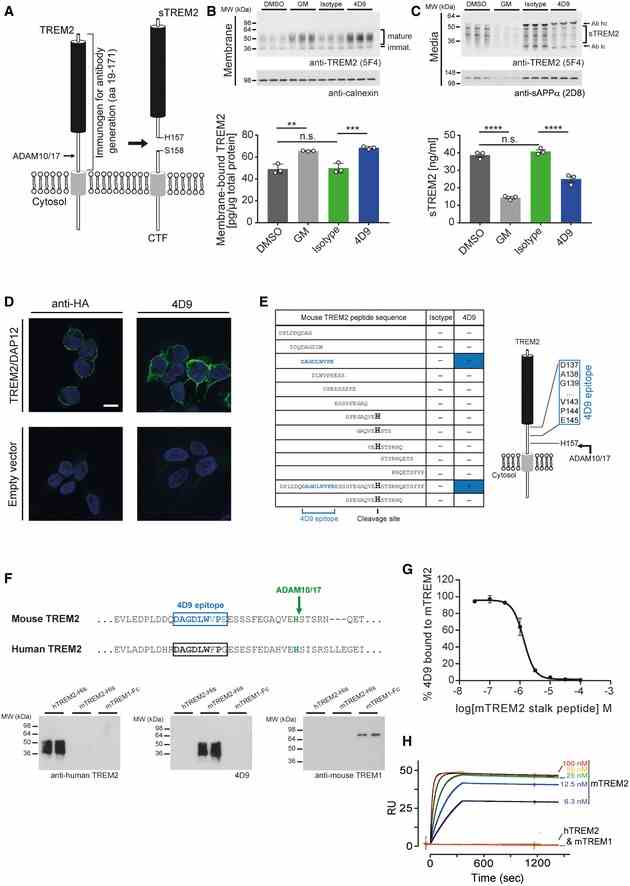
Schematic representation of TREM2 processing by ADAM10/17. Cleavage occurs C‐terminal of residue His 157. The entire ectodomain (residues 19–171) was used for immunization of rats to generate TREM2 antibodies. CTF, C‐terminal fragment; sTREM2, soluble TREM2. Immunoblot analysis of membrane fractions of HEK293 Flp‐In cells stably overexpressing both mouse TREM2 and mouse DAP12 upon treatment with 4D9 antibody reveals increased levels of membrane‐bound TREM2 similar to what can be achieved by ADAM protease inhibition using the GM6001 inhibitor. An isotype antibody was used as a negative control. Calnexin served as a loading control. Levels of membrane‐bound TREM2 were quantified by MSD ELISA. Data represent the mean ± SEM ( n = 3). One‐way ANOVA, Tukey's post hoc test; P (DMSO vs GM) = 0.0011; P (DMSO vs isotype) = 0.992; P (isotype vs 4D9) = 0.0005; n.s., not significant. Immunoblot analysis of conditioned media from HEK293 Flp‐In cells stably overexpressing both mouse TREM2 and mouse DAP12 upon treatment with 4D9 antibody reveals decreased levels of sTREM2 similar to what can be achieved by ADAM protease inhibition using the GM6001 inhibitor. An isotype antibody was used as a negative control. sAPPα served as a loading control. Note that heavy and light chains of the antibodies used for treatment are also detected and annotated. Levels of sTREM2 were quantified by MSD ELISA. Data represent the mean ± SEM ( n = 3). One‐way ANOVA, Tukey's post hoc test; P (DMSO vs GM) < 0.0001; P (DMSO vs isotype) = 0.6372; P (isotype vs 4D9) < 0.0001; n.s., not significant. 4D9 antibody selectively detects TREM2 on the cell surface of HEK293 Flp‐In cells stably overexpressing mouse TREM2 and mouse DAP12. An anti‐HA antibody was used as a positive control, while empty vector‐transfected HEK293 Flp‐In cells were used as a negative control. Scale bar = 10 μm. Peptide ELISAs detect anti‐mouse TREM2 antibody binding to tiled stalk region peptides, full‐length stalk peptide, or a truncated ADAM cleavage site peptide. The binding epitope of 4D9 antibody is located 12‐amino acids N‐terminal of the ADAM cleavage site at His 157. Sequence comparison of mouse TREM2 and human TREM2 shows substantial sequence conservation around the 4D9 epitope (upper panel). Immunoblot analysis demonstrates that antibody 4D9 is highly specific for mouse TREM2 and does not detect human TREM2 or mouse TREM1 (lower panel). 4D9 binding to the mouse TREM2 ECD is competed off by a stalk region peptide. A competition ELISA demonstrates that a dose titration of stalk peptide reduces binding of 4D9 to TREM2 ECD with an EC50 of 1.3 μM. Data represent the mean ± SEM ( n = 3). ECD, extracellular domain. Surface plasmon resonance binding kinetics of increasing concentrations of 4D9 antibody to mouse TREM2 ECD evaluated by Biacore, k on = 5.9 × 10 5 M ?1 s ?1 , k off = 4.0 × 10 ?5 s ?1 , K D = 68 pM. 4D9 binding to human TREM2 or mouse TREM1 was undetectable. Data information: Statistical evaluations are displayed as follows: ** P < 0.01; *** P < 0.001; **** P < 0.0001. Source data are available online for this figure.
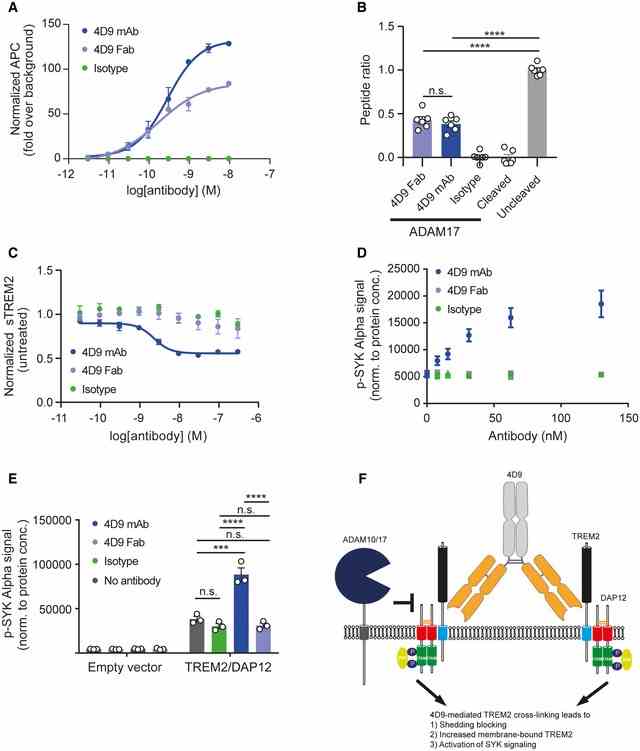
Flow cytometry dose–response curve for cell binding of 4D9 mAb (EC50 = 0.29 nM), 4D9 Fab (EC50 = 0.17 nM), and isotype to HEK cells stably overexpressing mouse TREM2. Data represent the mean ± SEM ( n = 2). In vitro ADAM17 sheddase activity is blocked by 4D9‐effectorless mAb and 4D9 Fab fragment but not an isotype control. Fluorescence polarization of FAM‐conjugated TREM2 stalk peptide was detected in the presence or absence of ADAM17 and 4D9 mAb, 4D9 Fab, and isotype control. Data represent the mean ± SEM ( n = 6). One‐way ANOVA, Tukey's post hoc test; P (4D9 Fab vs 4D9 mAb) = 0.8855; P (4D9 Fab vs uncleaved) < 0.0001; P (4D9 mAb vs uncleaved) < 0.0001; n.s., not significant. ELISA‐mediated quantification of sTREM2 in conditioned media from HEK293 cells stably overexpressing mouse TREM2 treated with a dose titration of 4D9 mAb (EC50 = 2.3 nM), 4D9 Fab, or isotype for 18 h. Data represent the mean ± SEM ( n = 3). AlphaLISA‐mediated quantification of p‐SYK levels in HEK293 Flp‐In cells stably overexpressing mouse TREM2 and mouse DAP12 treated with a dose titration of 4D9 mAb, 4D9 Fab, or isotype for 5 min. Data represent the mean ± SEM ( n = 3). AlphaLISA‐mediated quantification of p‐SYK levels in HEK293 Flp‐In cells stably overexpressing mouse TREM2 and mouse DAP12 or empty vector treated with 1 mg/ml POPC/POPS liposomes and 20 μg/ml 4D9 mAb, 4D9 Fab, or isotype for 5 min. p‐SYK levels were also determined for cells treated with liposomes only. Data represent the mean ± SEM ( n = 3). Two‐way ANOVA, Tukey's post hoc test (cell line effect: F 1,16 = 365.7, P ≤ 0.0001; treatment effect: F 3,16 = 39.35, P < 0.0001; cell line × treatment effect: F 3,16 = 38.75, P < 0.0001); P (no Ab vs isotype) = 0.6218; P (no Ab vs 4D9 mAb) < 0.0001; P (no Ab vs 4D9 Fab) = 0.7301; P (isotype vs 4D9 mAb) < 0.0001; P (isotype vs 4D9 Fab) > 0.9999; P (4D9 mAb vs 4D9 Fab) < 0.0001; n.s., not significant. Schematic representation of the proposed mechanism of action of antibody 4D9. Binding of 4D9 to TREM2 leads to receptor clustering on the cell surface, thereby driving downstream p‐SYK signaling. At the same time, cell‐surface levels are enhanced by inhibition of ectodomain shedding, potentially because of the inability of proteases to cleave dimeric substrates. Data information: Statistical evaluations are displayed as follows: *** P < 0.001; **** P < 0.0001.
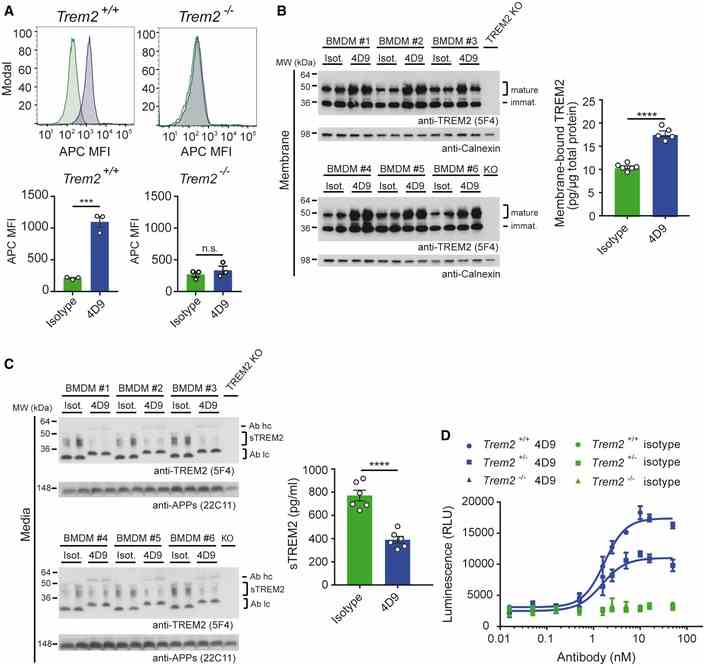
Flow cytometry detection of cell‐surface binding of 4D9 (blue) and isotype (green) to wild‐type and Trem2 ? / ? mouse bone marrow‐derived macrophages. Representative histograms are shown as MFI (mean fluorescent intensity). Graphs represent the median signal intensity ± SEM ( n = 3). Student's t ‐test (two‐tailed); Trem2 +/+ : P = 0.0005; Trem2 ?/? : P = 0.4435; n.s., not significant. Immunoblot analysis of membrane fractions of bone marrow‐derived macrophages (BMDMs) upon treatment with 4D9 antibody reveals increased levels of membrane‐bound TREM2 relative to an isotype antibody. BMDMs from TREM2 knockout mice were included to show the specificity of the anti‐TREM2 antibody. Calnexin served as a loading control. Levels of membrane‐bound TREM2 were quantified by MSD ELISA. TREM2 antibody clone 5F4 was used for detection. Data represent the mean ± SEM ( n = 5–6). Unpaired t ‐test (two‐tailed) with Welch's correction; P < 0.0001. No gender‐specific differences could be observed. Immunoblot analysis of sTREM2 in conditioned media from BMDM upon treatment with 4D9 and isotype antibodies. BMDMs from TREM2 knockout mice were included to show the specificity of the anti‐TREM2 antibody. Soluble APP served as a loading control. Note that heavy and light chains of the antibodies used for treatment are also detected and annotated as follows: Ab hc, antibody heavy chain; Ab lc, antibody light chain. Levels of sTREM2 were quantified by MSD ELISA. TREM2 antibody clone 5F4 was used for detection. Data represent the mean ± SEM ( n = 6). Unpaired t ‐test (two‐tailed) with Welch's correction; P < 0.0001. No gender‐specific differences could be observed. Wild‐type, Trem2 +/? , and Trem2 ?/? BMDMs were plated in low concentration of M‐CSF on 4D9 or isotype‐coated wells for 5 days, and cellular ATP levels were measured by luminescence detection to indicate cell viability. 4D9 and isotype data for each genotype represent the mean ± SEM ( n = 2 and n = 1, respectively). Data information: Statistical evaluations are displayed as follows: *** P < 0.001; **** P < 0.0001. Source data are available online for this figure.
TREM2 deficiency reduces the efficacy of immunotherapeutic amyloid clearance
Journal: EMBO Molecular Medicine PubMed ID: 27402340 Data: 2016/7/8
Authors: Xianyuan Xiang, Georg Werner, Christian Haass
Article Snippet:For immunofluorescence staining of BMDM and primary microglia, staining was performed using rat anti‐CD68 (1:500; AbD Serotec) and goat anti‐rat Alexa Fluor 555 (1:200; Thermo Fisher Scientific).For immunofluorescence staining of BMDM and primary microglia, staining was performed using rat anti‐CD68 (1:500; AbD Serotec) and goat anti‐rat Alexa Fluor 555 (1:200; Thermo Fisher Scientific).. For Western blotting of TREM2, we raised a rat monoclonal antibody (clone 5F4; 1:50) against the extracellular domain of murine TREM2 (Creative BioMart; Trem2‐3276M).. Further used antibodies were rat antibody 2D8 (1:100) (Shirotani et al , ) against Aβ, rabbit anti‐calnexin (1:3,000; Enzo Life Sciences), secondary antibodies HRP‐conjugated goat anti‐rat (1:5,000; Santa Cruz Biotechnology), and goat anti‐rabbit IgG (1:10,000; Promega).Further used antibodies were rat antibody 2D8 (1:100) (Shirotani et al , ) against Aβ, rabbit anti‐calnexin (1:3,000; Enzo Life Sciences), secondary antibodies HRP‐conjugated goat anti‐rat (1:5,000; Santa Cruz Biotechnology), and goat anti‐rabbit IgG (1:10,000; Promega).
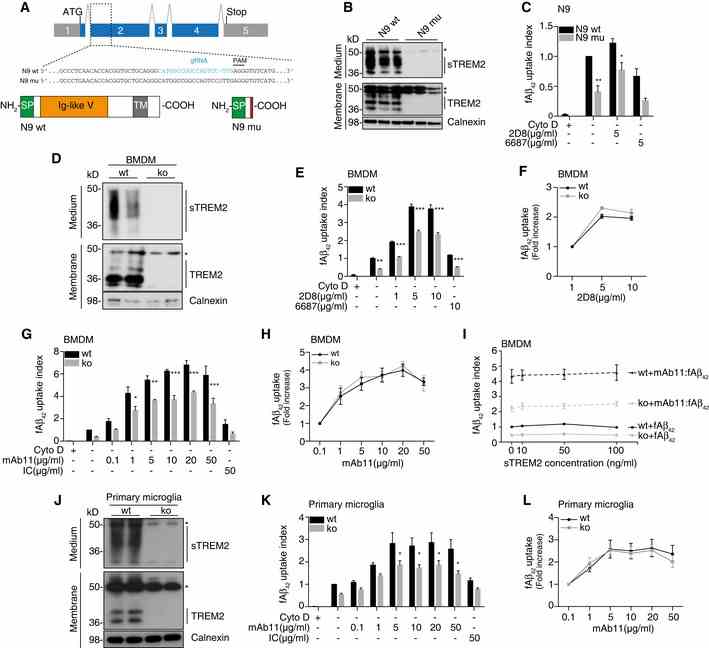
Schematic of the mouse Trem2 locus and the TREM2 protein. Sequence alignment of wild‐type N9 (N9 wt) and TREM2 mutant N9 (N9 mu) surrounding the gRNA target site. The gRNA sequence is in cyan, and protospacer‐adjacent motif (PAM) is marked with a line. The single nucleotide insertion is labeled in red. Schematic representation of wild‐type TREM2 (NP_112544.1) and CRISPR/Cas9‐modified TREM2 (N9 mu). TM, transmembrane domain; SP, signal peptide. Western blot analysis of lysates and media from wt and mutant N9 cells (N9 wt /mu) using the antibody anti‐murine TREM2 (clone 5F4), which is raised against the murine TREM2 extracellular domain. sTREM2, soluble TREM2. *indicate unspecific bands. Calnexin was used as a loading control. Phagocytosis of 1 μM HiLyte ? Fluor 488 Aβ 1‐42 (fAβ 42 ) by N9 wt and N9 mu in the presence or absence of antibody 2D8 or the non‐binding antibody 6687. Cytochalasin D (CytoD, 10 mM) was used as control to verify phagocytic uptake. ( n = 4, ± SEM; two‐way ANOVA, interaction P = 0.61, genotype P < 0.0001, treatment P = 0.0001; post hoc tests wt vs. mu for the following conditions: fAβ 42 P = 0.0043, fAβ 42 ‐2D8 P = 0.0436). Western blot of BMDM derived from wt and Trem2 knockout (ko) animals using antibody 5F4. *indicate unspecific bands. Phagocytosis of fAβ 42 by BMDM from wt and Trem2 ko animals in the presence or absence of 2D8, or the non‐binding control antibody 6687. ( n = 3, ± SEM; two‐way ANOVA, interaction P = 0.0005, genotype P < 0.0001, treatment P < 0.0001; post hoc tests wt vs. ko for the following conditions: fAβ 42 P = 0.0021, fAβ 42 ‐2D8 1 μg/ml P < 0.0001, fAβ 42 ‐2D8 5 μg/ml P < 0.0001, fAβ 42 ‐2D8 10 μg/ml P < 0.0001, fAβ 42 /6687 10 μg/ml P = 0.0007). Quantification of relative fAβ 42 uptake to lowest antibody concentration used ( n = 3, ± SEM). Phagocytosis of fAβ 42 by BMDM from wt and Trem2 ko animals in the presence or absence of mAb11, or an isotype control antibody (IC). ( n = 4, ± SEM; two‐way ANOVA, interaction P = 0.0223, genotype P < 0.0001, treatment P < 0.0001; post hoc tests wt vs. ko for the following conditions: fAβ 42 ‐mAb11 1 μg/ml P = 0.0391, fAβ 42 ‐mAb11 5 μg/ml P = 0.0069, fAβ 42 ‐mAb11 10 μg/ml P < 0.0001, fAβ 42 ‐mAb11 20 μg/ml P = 0.0001, fAβ 42 ‐mAb11 50 μg/ml P < 0.0001). Quantification of relative fAβ 42 uptake to lowest antibody concentration used ( n = 4, ± SEM). Recombinant mouse sTREM2 does not rescue fAβ 42 uptake in Trem2 ‐deficient BMDM. Increasing amounts of sTREM2 were added to the media of wt or Trem2 ko BMDM in the presence or absence of mAb11 (10 μg/ml) ( n = 4, ± SEM). Western blot of primary microglia from wt or Trem2 ko animals using antibody 5F4. *indicate unspecific bands. Phagocytosis of fAβ 42 by primary microglia from wt and Trem2 ko animals in the presence or absence of mAb11, or an isotype control antibody (IC). ( n = 5, ± SEM; two‐way ANOVA, interaction P = 0.4797, genotype P < 0.0001, treatment P < 0.0001; post hoc tests wt vs. ko for the following conditions: fAβ 42 ‐mAb11 5 μg/ml P = 0.0449, fAβ 42 ‐mAb11 10 μg/ml P = 0.0370, fAβ 42 ‐mAb11 20 μg/ml P = 0.0299, fAβ 42 ‐mAb11 50 μg/ml P = 0.0120). Quantification of relative fAβ 42 uptake to lowest antibody concentration used ( n = 5, ± SEM). Data information: (C, E, G, K) Quantification of internalized fAβ 42 was normalized to wt without antibody. Bonferroni‐corrected pair‐wise post hoc tests were used. Source data are available online for this figure.
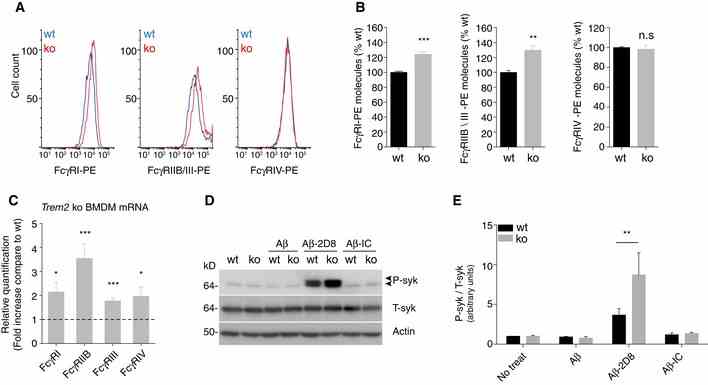
Representative histograms for Fcγ‐receptors‐PE (FcγR‐PE) expression levels as used for quantification. Stacked histograms for log PE fluorescence intensity of wt and Trem2 ko BMDM are shown for the respective FcγR (I, IIB/III, and IV). Relative quantification of cell surface levels of FcγR molecules. Absolute number of cell surface FcγR‐PE molecules was determined by the BD QuantiBRITE? method (see methods section for details) and normalized to expression levels of the respective wt control. ( n = 4, ± SEM, t ‐test, two‐tailed; wt vs. ko: FcγRI‐PE P = 0.0008, FcγRIIB/III‐PE P = 0.0033, FcγRIV‐PE P = 0.7001). mRNA levels of FcγR are increased in Trem2 ko BMDM. Fold changes of the respective FcγR (I, IIB, III, IV) mRNA levels in Trem2 ko BMDM were determined by quantitative real‐time PCR. ( n = 6, ± SEM; one‐sample t ‐test, two‐tailed; wt vs. ko: FcγRI P = 0.0118, FcγRIIB P = 0.0006, FcγRIII P = 0.0004, FcγRIV P = 0.0284) Phosphorylated Syk (P‐Syk) and total Syk (T‐Syk) levels were determined by Western blotting in lysates from wt and Trem2 ko BMDM after 1 h treatment with Aβ alone, together with antibody 2D8 (Aβ‐2D8), or an isotype control (Aβ‐IC). Actin was used as a loading control. Quantification of P‐Syk normalized to T‐Syk. ( n = 4, ± SEM; 2 way ANOVA, interaction P = 0.0490, genotype P = 0.0898, treatment P < 0.0001. Bonferroni‐corrected pair‐wise post hoc tests, ** P = 0.0075 vs. wt). Source data are available online for this figure.
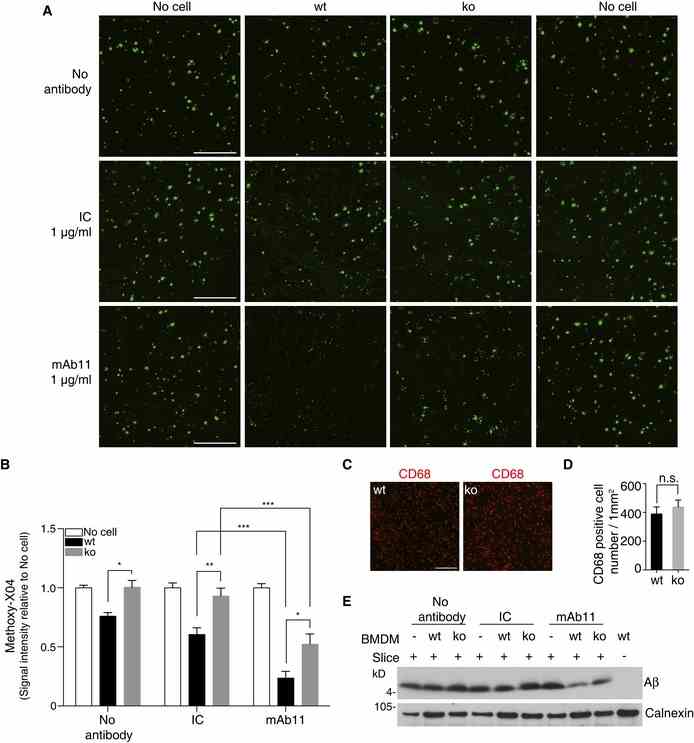
A BMDM from wt or Trem2 ko mice were cultured on APP/PS1 mice brain cryosections incubated with or without mAb11 (1 μg/ml) or an isotype control (IC; 1 μg/ml) for 24 h. Sections were then probed with methoxy‐X04. Scale bar, 500 μm. B The amyloid plaque load was quantified from the entire sagittal section. Sections incubated with medium (no cell) were set as baseline. ( n = 6, ± SEM; two‐way ANOVA, interaction P < 0.0001, genotype P < 0.0001, treatment P < 0.0001; Tukey's multiple comparisons tests; wt vs. ko for the following conditions: no antibody P = 0.0304, IC P = 0.0049, mAb11 P = 0.0212; wt: IC vs. wt: mAb11 P = 0.0008; ko: IC vs. ko: mAb11 P = 0.0001). C, D Equal numbers of wt and Trem2 ko BMDM were added, and cell numbers were analyzed after termination of experiments by quantifying the CD68‐positive cells on top of the sections. ( n = 4, ± SEM; t ‐test; n.s., non‐significant, P = 0.5004). Scale bar, 200 μm. E Aβ was extracted by urea buffer from replicate slices of the experiment shown in (A), and total Aβ was identified by Western blotting. Source data are available online for this figure.