


Recombinant Rat S100A1 Protein
| Cat.No. : | S100A1-5210R |
| Product Overview : | Recombinant Rat S100A1 full length or partial length protein was expressed. |
- Specification
- Gene Information
- Related Products
- Citation
- Download
| Species : | Rat |
| Source : | Mammalian Cells |
| Tag : | His |
| Form : | Liquid or lyophilized powder |
| Endotoxin : | < 1.0 EU per μg of the protein as determined by the LAL method. |
| Purity : | >80% |
| Notes : | This item requires custom production and lead time is between 5-9 weeks. We can custom produce according to your specifications. |
| Storage : | Store it at +4 ºC for short term. For long term storage, store it at -20 ºC~-80 ºC. |
| Storage Buffer : | PBS buffer |
| Gene Name | S100a1 S100 calcium binding protein A1 [ Rattus norvegicus ] |
| Official Symbol | S100A1 |
| Gene ID | 295214 |
| mRNA Refseq | NM_001007636.2 |
| Protein Refseq | NP_001007637.1 |
| MIM | |
| UniProt ID | P35467 |
| ◆ Recombinant Proteins | ||
| S100a1-5664M | Recombinant Mouse S100a1 Protein, Myc/DDK-tagged | +Inquiry |
| S100A1-2480H | Recombinant Human S100A1, GST-tagged | +Inquiry |
| S100A1-3457H | Recombinant Human S100A1 protein, His-SUMO-tagged | +Inquiry |
| S100A1-5210R | Recombinant Rat S100A1 Protein | +Inquiry |
| S100A1-830HFL | Recombinant Full Length Human S100A1 Protein, C-Flag-tagged | +Inquiry |
| ◆ Cell & Tissue Lysates | ||
| S100A1-2861HCL | Recombinant Human S100A1 cell lysate | +Inquiry |
Bioactive nanoparticles improve calcium handling in failing cardiac myocytes
Journal: Nanomedicine PubMed ID: 26223412 Data: 2015/11/1
Authors: Joshua T Maxwell, Inthirai Somasuntharam, Mary B Wagner
Article Snippet:Fluorescent Ca 2+ indicator dyes were purchased from Molecular Probes/Invitrogen (CA, USA).Fluorescent Ca 2+ indicator dyes were purchased from Molecular Probes/Invitrogen (CA, USA).. S100A1 recombinant protein was purchased from Creative BioMart (NY, USA), reconstituted in water at 0.5 μg/μl, and stored at -80°C until use.. Tyrode's solution contained (in mM) 138 NaCl, 4 KCl, 2 CaCl 2 , 1 MgCl 2 , 10 glucose and 10 HEPES; pH 7.4 with NaOH.Tyrode's solution contained (in mM) 138 NaCl, 4 KCl, 2 CaCl 2 , 1 MgCl 2 , 10 glucose and 10 HEPES; pH 7.4 with NaOH.
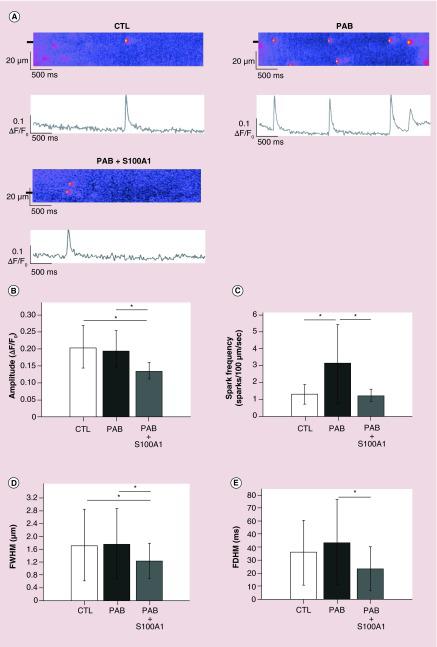
(A) Representative confocal line scans and the corresponding fluorescence profiles (ΔF/F0) of Ca2+ sparks from permeabilized rat myocytes from CTL, PAB or PAB treated with de-encapsulated
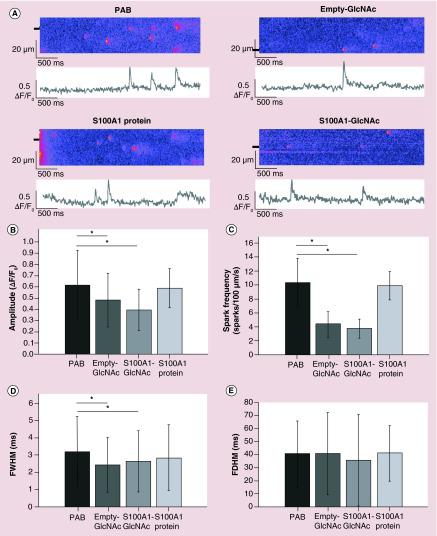
(A) Representative line scans and the corresponding fluorescence profiles (ΔF/F0) of Ca2+ sparks from intact rat myocytes from PAB or PAB treated with empty GlcNAc nanoparticles (empty-GlcNAc),
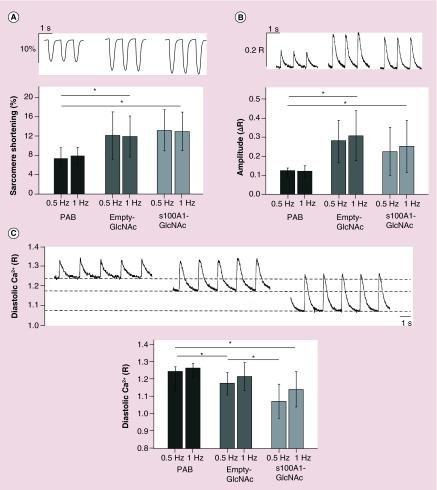
(A) Representative sarcomere shortening, (B) Ca2+ transient amplitude and (C) diastolic Ca2+ traces from PAB, empty-GlcNAc treated and
Not For Human Consumption!
Inquiry
- Reviews (0)
- Q&As (0)


Ask a Question for All S100A1 Products
Required fields are marked with *
My Review for All S100A1 Products
Required fields are marked with *